11 Simple 'Set and Forget' Portfolios For Stress-Free Investing
11 Simple 'Set and Forget' Portfolios For Stress-Free Investing
Summary
- Investing with a static portfolio allocation allows investors to "Set and Forget."
- "Set and Forget" portfolio options include all-in-one mutual funds and also ETF portfolios with a fixed asset allocation.
- We analyze 11 static portfolios based on risk vs. return.
- We compare these 11 portfolios to each other using scatterplots to visualize risk vs. return.
- We also compare these 11 portfolios to a balanced portfolio (60% equity + 40% bonds), and to a few tactical portfolios.

If you're looking for a low-effort portfolio strategy with decent risk vs. return metrics, you've got several options. You can invest in a "fund of funds" or an "all-in-one" mutual fund that invests in multiple asset classes. Or you can hire a financial advisor to formulate a portfolio and rebalance it for you. This article focuses on some additional options in the "do it yourself" vein.
But first, what are we calling a "Set and Forget" portfolio? We'll look at portfolios that are either:
- a single exchange-traded fund (ETF) or mutual fund, or
- a static allocation of ETFs (i.e., a fixed percentage allocation across a set of ETFs)
Portfolios to consider
The 11 "Set and Forget" portfolios that we've chosen are from the list of strategic and tactical model portfolios that we track at RecipeInvesting.com. The chosen portfolios include some from famous managers and respected fund companies. Here's the lineup:
Harry Browne-Inspired Portfolio (s.brow). This model portfolio (which we call a "Portfolio Recipe") invests 25% in each of four major asset classes: U.S. Total Stock Market (VTI), U.S. Long Term Treasury Bonds (TLT), Gold (GLD), and Short Term Treasury Bonds (SHY).
Ben Stein-Inspired Portfolio (s.bens). This portfolio uses an approach described by Ben Stein. This invests in exchange-traded funds, as follows: SPY=20%, VTI=20%, EFA=20%, EEM=12%, VNQ=4%, XLE=4%, SHY=20%
Strategic 50-50 Portfolio (s.5050) This portfolio recipe invests in two exchange-traded funds, as follows: VTI=50%, BND=50%
Strategic 80-20 Portfolio (s.8020) This portfolio recipe also invests in two exchange-traded funds, but with a heavier equity weighting: (VTI=80%, BND=20%).
Talmud Equities and Gold Portfolio (s.talg) implements a portfolio strategy based on a Talmudic text which advises an allocation to land, business, and cash. This version (one of five Talmud Portfolio variations that we track at RecipeInvesting.com) uses a U.S. real-estate ETF (VNQ), a U.S. stock ETF (VTI), and a gold ETF (GLD).
S&P 500 Equal Weight (RSP) invests in each component company in equal proportion, instead of weighting the allocation by each company's market capitalization.
Permanent Portfolio (MUTF:PRPFX) is a mutual fund that invests in gold, silver, Swiss Francs, real estate, natural resources stocks, aggressive growth stocks, and dollar assets.
Hundredfold Select Fund (MUTF:SFHYX) is a mutual fund that invests in both equities and fixed income securities.
Vanguard Wellington Fund (VWELX) is a balanced mutual fund from Vanguard, investing in both stocks and fixed income securities.
Janus Balanced Fund (JANBX) is a balanced portfolio from Janus Henderson, investing in both stocks and fixed income securities.
Vanguard Wellesley Fund (VWIAX) is a mutual fund investing in equities and fixed income, but with a higher allocation to fixed income than Vanguard Wellington.
Plus, we've added a Balanced Portfolio as a benchmark, consisting of two ETFs: 60% stocks (VTI) and 40% bonds (BND). We'll use the abbreviation s.6040 to refer to this Balanced Portfolio benchmark.
The advantages of strategic investing with a static portfolio.
Static portfolios are simple and have lower costs due to less trading activity. A static strategy can also help you maintain your investing discipline. You can remove the emotion from your investing decisions by picking an allocation method, sticking with it, and not getting flustered by short-term market fluctuations.
Another advantage of a static portfolio is the potential for long-term capital appreciation. With less portfolio turnover, you get the compounding effect of investment returns without tax-triggering asset sales. When you do periodic rebalancing, instead of selling part of a position to rebalance to the target portfolio percentages, you can add new funds to "top up" the amount invested in a portfolio ingredient (e.g., an ETF) that has fallen behind its target allocation.
The disadvantages of strategic investing with a static portfolio.
A potential drawback of a static portfolio is its limited adaptability to the changing market: economic landscapes shift, companies struggle, tax policy adjusts, inflation varies, industry trends evolve, and opportunities emerge. With a static portfolio, you may find it difficult to resist the urge to adjust your holdings to capitalize on these events.
Risk and return metrics (and benchmarks)
For each portfolio, we'll look at risk vs. return over the past 5 and 20 years. For the risk metric, we'll use Maximum Drawdown, which we define as the largest peak-to-trough decline in total return over the period, as measured at the end of each month. For return, we'll use total annualized return, which includes reinvested distributions and dividends.
Examining the 5-year Risk vs. Return
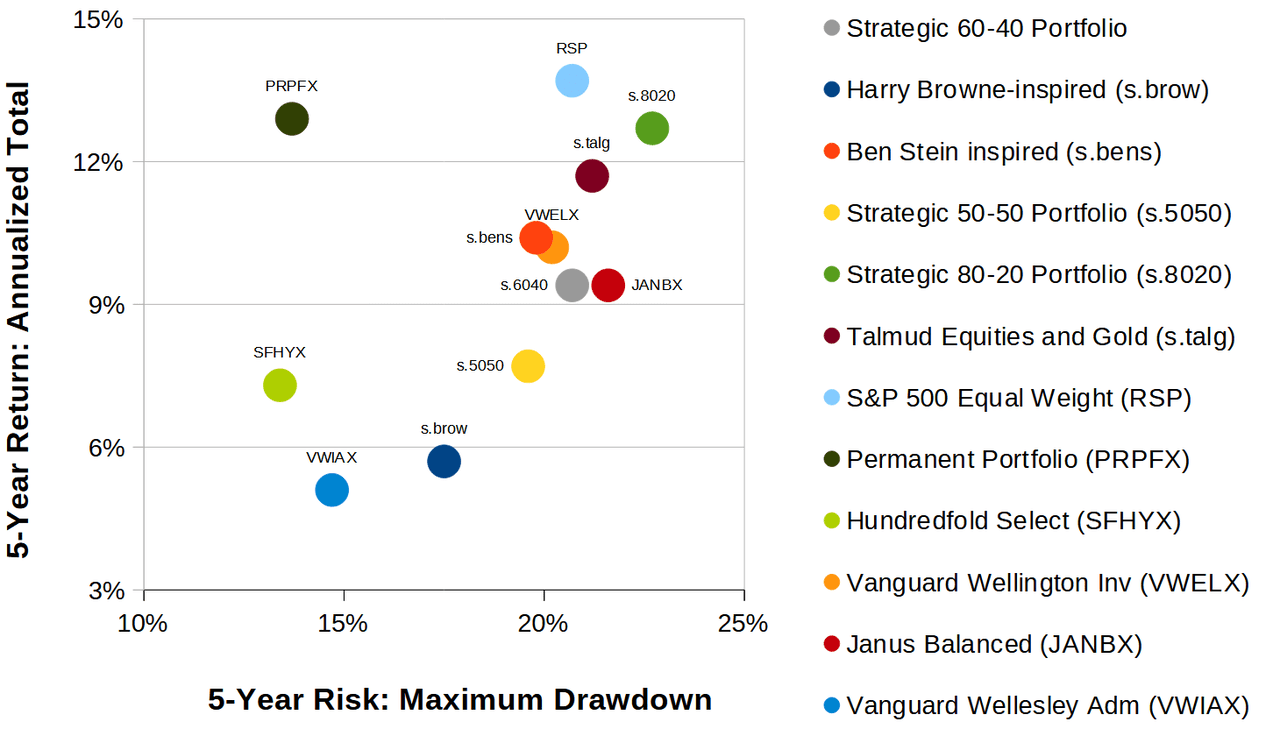
Exhibit A, below, compares risk vs. return for all 11 portfolios in a single scatterplot, covering the past five years.

It's interesting to note that only four portfolios beat the s.6040 benchmark (shown as a gray dot) in terms of both risk and return:
S&P 500 Equal Weight (RSP), the light blue dot in Exhibit A, stands out with the highest 5-year annualized return of 13.7%, but it also comes with a higher maximum drawdown of 20.7%.
Vanguard Wellington (VWELX), the orange dot in Exhibit A, is quite close to the benchmark, but with a higher return and lower risk.
The Ben Stein-Inspired Portfolio (s.bens), the bright red dot in Exhibit A, is similar to VWELX, but with slightly better risk and return performance.
The Permanent Portfolio (PRPFX) mutual fund, the dark gray dot in Exhibit A, is the standout here with much better return and risk compared to the benchmark.
At the bottom of the scatterplot, portfolios like Vanguard Wellesley (VWELX) and the Harry Browne-Inspired Portfolio (s.brow) demonstrate more moderate returns, but also lower risk. But for an even better lower-risk option, Hundredfold Select (SFHYX) outperforms both VWELX and s.brow.
Diving Deeper with the 20-year Risk vs. Return
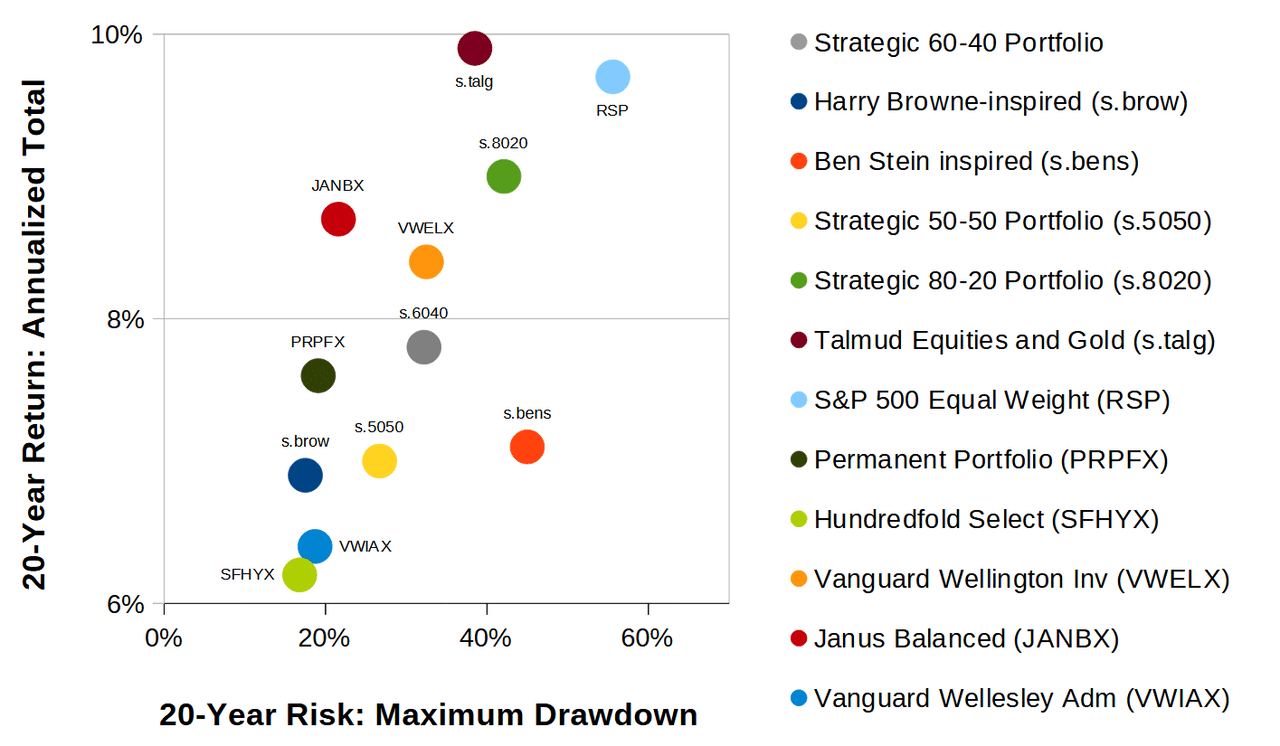
Now let's extend the analysis to look at the past 20 years, capturing key market downturns like the 2008 financial crisis.

Looking at the 20-year scatterplot, we're down to just one portfolio that beats the s.6040 benchmark in terms of both risk and return: Janus Balanced (JANBX), shown as the dark red dot in Exhibit B. A notable runner-up is Vanguard Wellington (VWELX) which beats the benchmark in total return, but with a slightly higher maximum drawdown.
Note that Talmud Equities and Gold (s.talg), at the top of the scatterplot, boasts the highest 20-year annualized return of the bunch at 9.9%. But this comes with a maximum drawdown of 38.5%.
Comparison to Tactical Portfolios
We should note that some tactical portfolios (also made with ETF ingredients) that we track at RecipeInvesting.com have yielded superior performance. However, to benefit from these, you need to do the required monthly rebalancing. Or, you could use an automated rebalancing tool such as Interactive Brokers' "Rebalance Portfolio" tool or M1 Finance's "Dynamic Rebalancing." Here are some examples of tactical high-performers:
- Adaptive Asset Allocation Portfolio (t.aaaf) has delivered a 13.8% annual return over the past 5 years and a 14.0% annual return over the last 20 years. The maximum drawdown for both periods is 19.0%.
- The Pure Momentum Portfolio (t.pure) has generated a 13.3% return in the last 5 years and a 14.9% annual return over the past 20 years, with a maximum drawdown of 34.9% for both periods.
- Faber Relative Strength Portfolio: Top 3 of 5 (t.frs3) has a 12.3% return with a 9.5% maximum drawdown over the past 5 years and a 9.6% return with a 17.3% maximum drawdown over the last 20 years.
Let's plot these three tactical portfolios alongside the static portfolios from above. See Exhibit C, below. The tactical portfolios are shown as orange dots, the static portfolio are tan dots, and the Strategic 60-40 Portfolio is a gray dot.
Exhibit C: Adding three tactical portfolio to the comparison

On the 5-year scatterplot, t.aaaf edges out a nearby dot, s.talg, which we discussed above.
The difference between the tactical portfolios and static portfolios is clearer on the 20-year plot. The orange dots outpace the static portfolios. But remember the price you must pay in terms of monthly rebalancing and associated tax consequences (if you hold these portfolios in a taxable account).
Exhibit D shows a tabular view of the risk and return metrics.
Exhibit D: All 11 "Set and Forget" Portfolios, plus a Balanced Portfolio benchmark
Fund Ticker or Portfolio ID | Portfolio Type | 5-year Annualized Return | 5-year Maximum Drawdown | 20-year Annualized Return | 20-year Maximum Drawdown |
s.brow | Strategic/Static | 5.7% | 17.5% | 6.9% | 17.5% |
s.bens | Strategic/Static | 10.4% | 19.8% | 7.1% | 45.0% |
s.5050 | Strategic/Static | 7.7% | 19.6% | 7.0% | 26.7% |
s.8020 | Strategic/Static | 12.7% | 22.7% | 9.0% | 42.1% |
s.talg | Strategic/Static | 11.7% | 21.2% | 9.9% | 38.5% |
RSP | Indexed | 13.7% | 20.7% | 9.7% | 55.6% |
PRPFX | Managed | 12.9% | 13.7% | 7.6% | 19.1% |
SFHYX | Managed | 7.3% | 13.4% | 6.2% | 16.8% |
VWELX | Balanced | 10.2% | 20.2% | 8.4% | 32.5% |
JANBX | Balanced | 9.4% | 21.6% | 8.7% | 21.6% |
VWIAX | Balanced | 5.1% | 14.7% | 6.4% | 18.7% |
s.6040 | Benchmark | 9.4% | 20.7% | 7.8% | 32.2% |
t.aaaf | Tactical | 13.8% | 19.0% | 14.0% | 19.0% |
t.pure | Tactical | 13.3% | 34.9% | 14.9% | 34.9% |
t.frs3 | Tactical | 12.3% | 9.5% | 9.6% | 17.3% |
Conclusion
Investing with a static "Set and Forget" portfolio allocation is an easy, cost-effective approach with the potential for long-term growth.
Over the 5-year period, Hundredfold Select (SFHYX) demonstrated moderate returns with lower drawdown. In contrast, more aggressive portfolios, such as the Strategic 80-20 Portfolio (s.8020) and S&P 500 Equal Weight (RSP), offer higher returns (12.7% and 13.7%, respectively) but these come with a higher maximum drawdown.
The 20-year analysis shows the longer-term trend: the Balanced Portfolio benchmark (s.6040) delivers a 7.8% return with a 32.2% maximum drawdown, but that is not as good as the Janus Henderson fund.
Finally, tactical portfolios may deliver better performance if you're up for monthly rebalancing. For example, the Adaptive Asset Allocation Portfolio (t.aaaf) achieved a 13.8% annual return over 5 years and 14.0% return over 20 years, both with a 19.0% maximum drawdown.
A static "Set and Forget" portfolio allocation comes with some risk/return trade-offs, but could save some time and stress if you find one that matches your investing style.
