2024 Portfolio Analysis Top ETFs Berkshire Hathaway Lazy Strategies
Top Country ETFs, Berkshire Hathaway, and Lazy Portfolios (Sep 2024)
Topics this month
- Top Country Fund ETFs for August 2024
- Berkshire Hathaway: Risk vs. Return Analysis
- A Top Portfolio Recipe: Faber Relative Strength Top 2
- Lazy Portfolios: a closer look at these strategic allocation portfolios
Welcome to the September 2024 commentary from recipeinvesting.com. We track investable portfolio recipes that allow investors and advisors to build portfolios that minimize risk and maximize return. We reallocate and rebalance monthly, so we have plenty of new material to cover for our comparisons this month.
Let's examine the data for the month ending August 31st, 2024, by viewing the content and making some key observations. Start by reviewing the portfolio recipes and then explore the recipe summary page. Next, the article briefly shifts the focus to the underlying exchange-traded funds (ETFs) within different peer groups, including global asset classes, global equities, and global sectors. This selection represents individual asset class ETFs that are monitored, along with portfolio recipes, which typically combine these or other mutual funds and ETFs.
Top Performing Country Fund ETFs for August 2024
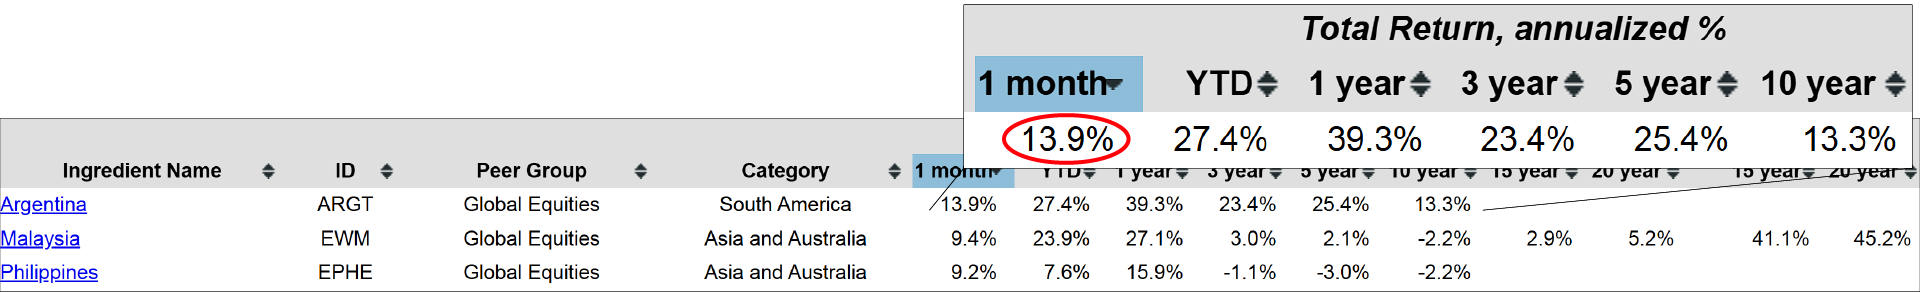
By selecting a one-month view at the top of the column, investors can identify the top performers. Notably, Argentina (ARGT) has shown remarkable strength, delivering a 13.9% return in just one month. Looking at performance over various time periods, including up to ten years, the numbers remain solid. However, we lack sufficient data to evaluate 15- or 20-year drawdown metrics, likely because the Argentina ETF doesn't have a long enough history. While the recent performance has been impressive, including over several years, it's important to remember that Argentina has a new government implementing policies that could positively impact inflation and other economic factors. Malaysia (EWM) and the Philippines (EPHE) are worth noting. However, it's crucial to avoid being overly influenced by strong short-term returns, especially if they come with significant volatility in the long run.
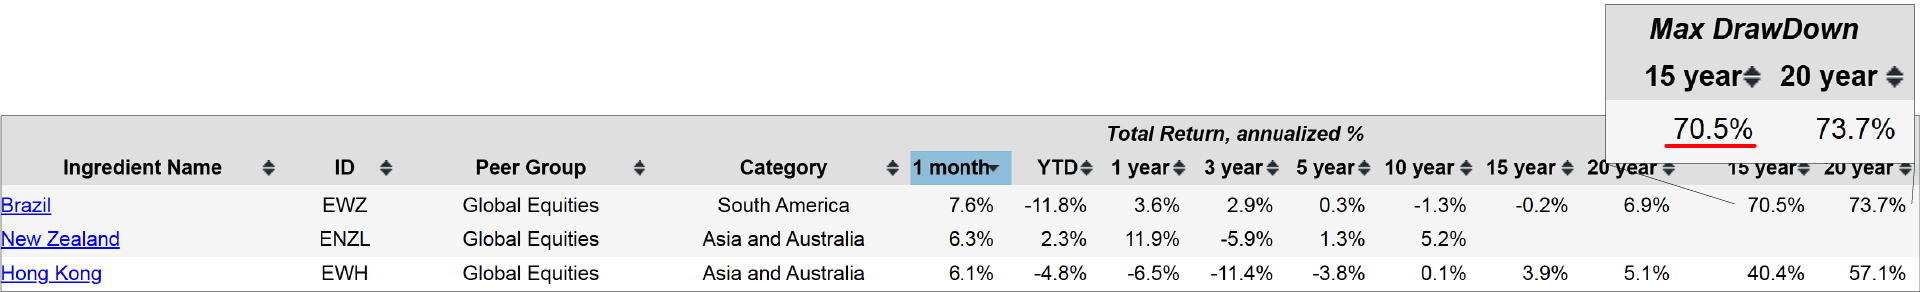
Over the last 15 years, Brazil (EWZ) has experienced a 70% drawdown, highlighting the significant risks involved. Such sharp declines, like this 70% drop, demonstrate how volatile exchange-traded funds (ETFs) tied to specific countries can be. Depending on the level of volatility, these investments can either perform well or pose considerable challenges.
Examining Top Portfolio Recipes
Berkshire Hathaway Inc
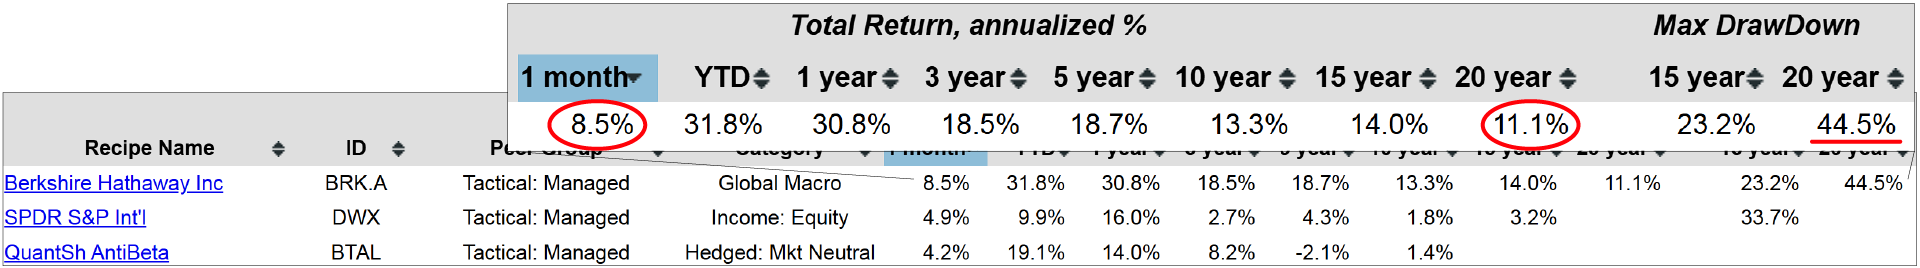
Let's return to the portfolio recipes for a similar quick overview by examining the one-month return. Here, we can identify the top performers from the past month, with Warren Buffett’s Berkshire Hathaway Inc. (BRK.A) continuing to deliver strong results. Classified as a "Global Macro" fund, Berkshire Hathaway is a conglomerate spanning multiple industries, following Buffett's investment methodology. It has not only performed well in the past month but also historically, achieving an 11.1% return over the past 20 years. While this is impressive, it's important to note that this performance hasn't been without risk. For instance, during the same period, the S&P 500 experienced a drawdown of around 50%. Although Berkshire Hathaway's decline wasn't as severe, it still faced significant risks despite its relatively stable returns.
It's worth noting that over the past month, the top performers in terms of return have predominantly been tactical managed portfolios. These include individual stocks as well as exchange-traded funds (ETFs) and mutual funds managed by professional portfolio managers. These managers have been demonstrating their value by delivering strong returns in the most recent month.
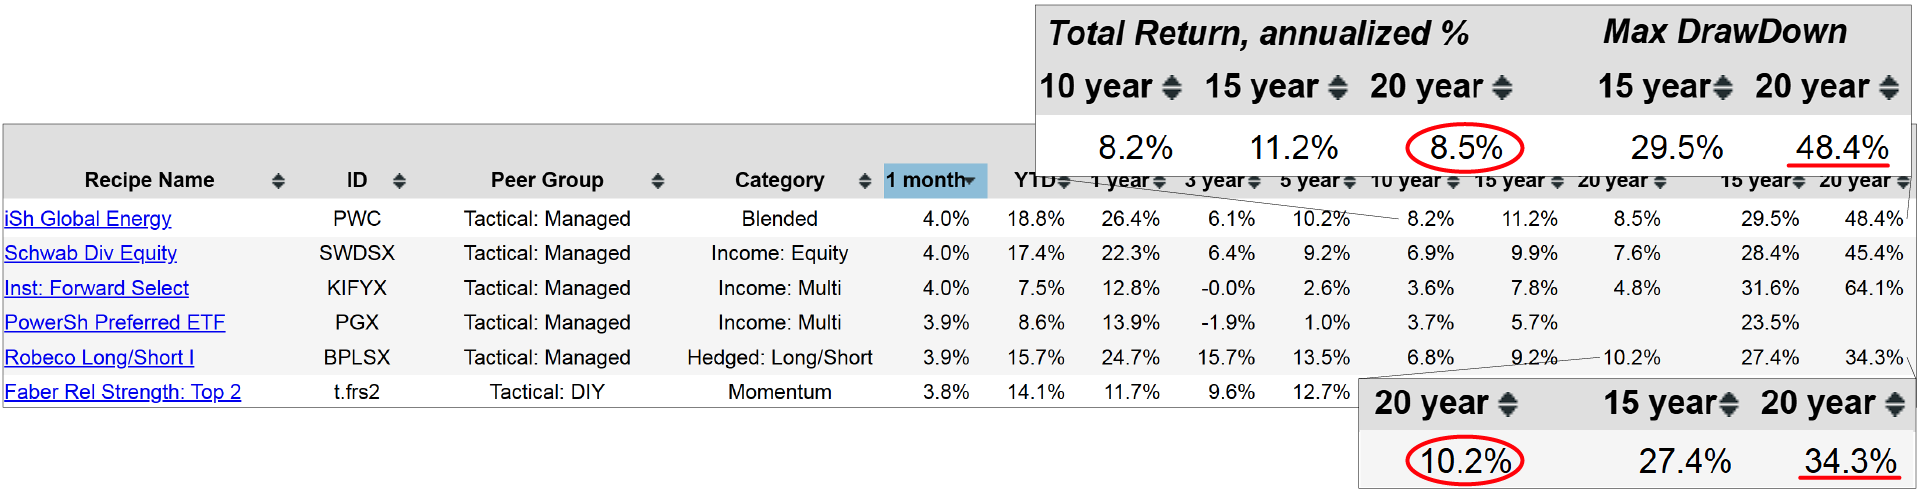
As with the ingredients, any recent performance should be evaluated in the context of long-term performance and balanced against the associated risks. It's not just about the return; the risk-return ratio is equally important. For example, iShares Global Energy (PWC) has delivered an 8.5% annualized return over the past 20 years, but with a significant drawdown of 48.4%. Another example is the Robeco Long/Short I (BPLSX), which, although it's an institutional fund not available to U.S. retail investors, serves as an interesting benchmark. This hedged mutual fund has achieved a 10.2% annualized return over the past 20 years, with a relatively lower drawdown of 34.3%. These examples show that tactical managers have performed well recently, with some demonstrating strong returns over the long term as well.
Faber Rel Strength: Top 2
We can also examine the list of top "Tactical" portfolios, specifically those we refer to as DIY, or do-it-yourself portfolios. Some of these have performed well over the past month and have shown consistent results across various time periods. For instance, the Faber Relative Strength: Top 2 (t.frs2) portfolio, which selects the top two funds from its available selection, has experienced a drawdown of only 26.1% over the past 20 years. This demonstrates its resilience and consistent performance over time. By selecting the Faber Relative Strength: Top 2 portfolio, investors can access the detailed page. This page provides insights into how the portfolio selects the top two out of five possible funds. It also includes a full description of its allocation methodology, which technically involves six components due to the inclusion of a cash element that may be allocated to a very short-term bond fund if the algorithm determines it necessary. Currently, the allocation is 50% to the VNQ Real Estate ETF and 50% to the SPY Large Cap ETF, which tracks the S&P 500. The allocation can change monthly or remain the same, depending on the portfolio's adjustments.
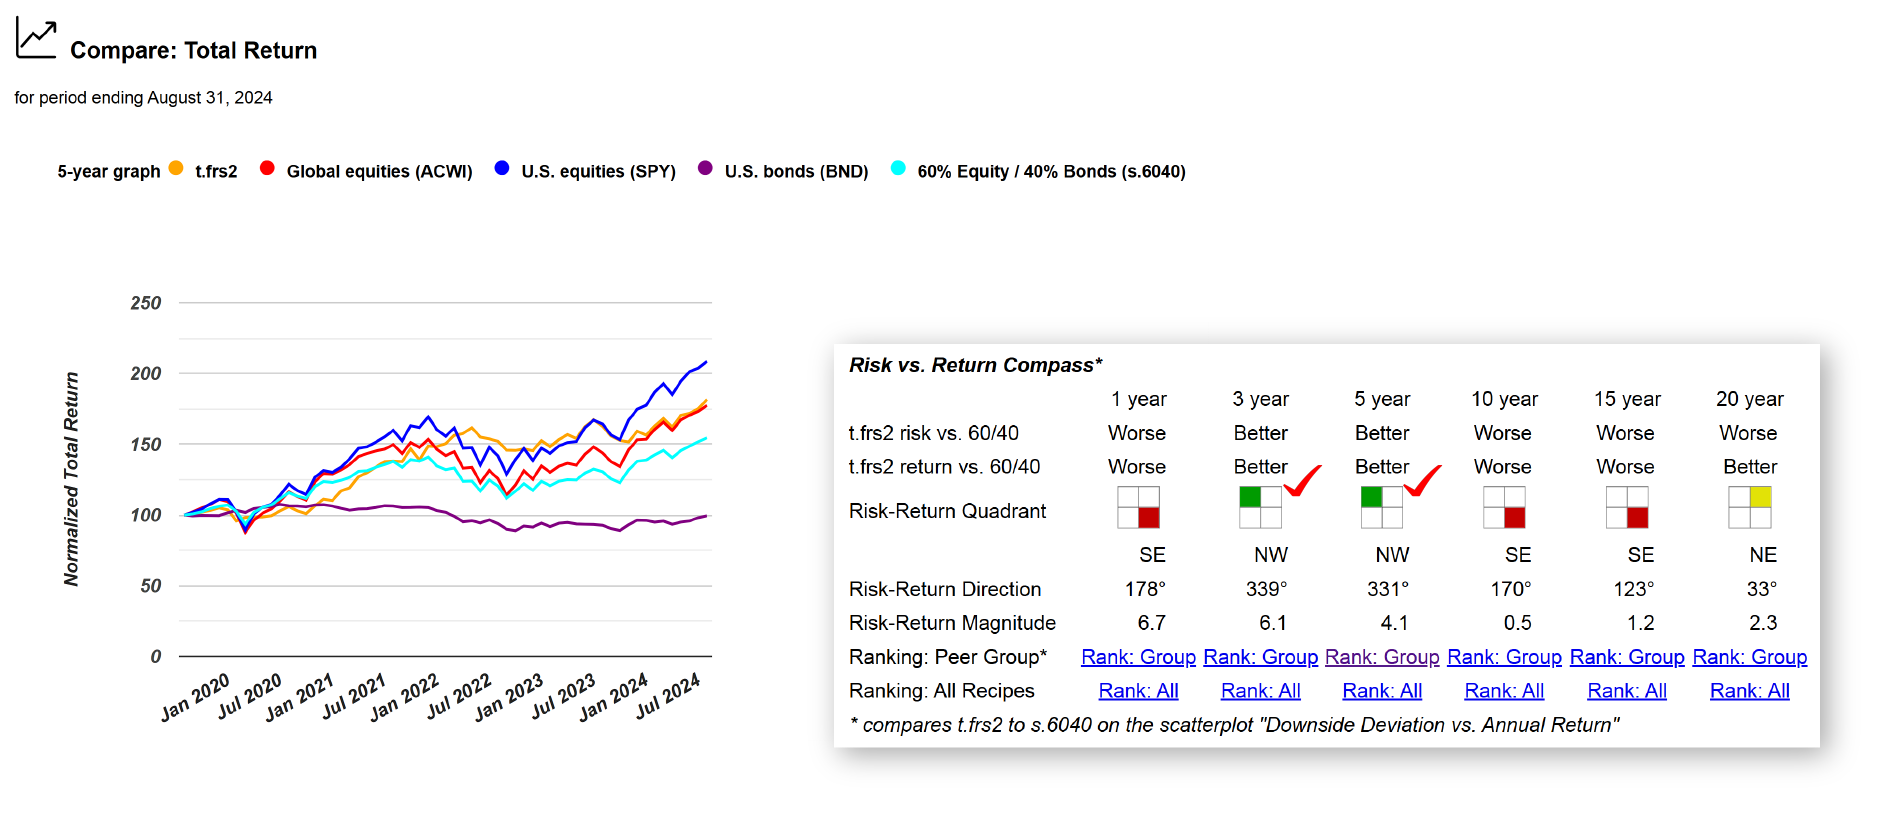
Over time, investors can observe the performance of the Faber Relative Strength: Top 2 portfolio, represented by the orange line. This portfolio has generally performed well, often matching or exceeding the Global Equities (ACWI), depicted by the red line. Recently, U.S. Equities (SPY), shown in the chart, have outperformed the Faber portfolio, though this comes with varying levels of risk.
The risk versus return compass is also used to visually represent where the Faber Relative Strength: Top 2 portfolio stands in relation to the balanced portfolio, which is 60% equities and 40% bonds, depicted by the teal dot. Over the past three years, the Faber portfolio has been positioned above and to the left of the balanced portfolio, indicating better returns with lower risk. This is marked with a green square in the upper left corner of the compass. However, over the past year and the past 15 years, the Faber portfolio has underperformed in both risk and return compared to the balanced portfolio. Over the past 20 years, while it has shown worse risk—measured by downside deviation—it has delivered better returns. This is represented by a yellow box, indicating that the portfolio has been above and to the left of the balanced portfolio, offering higher returns but with increased risk. The investors interest in this portfolio will depend on their risk-return appetite.
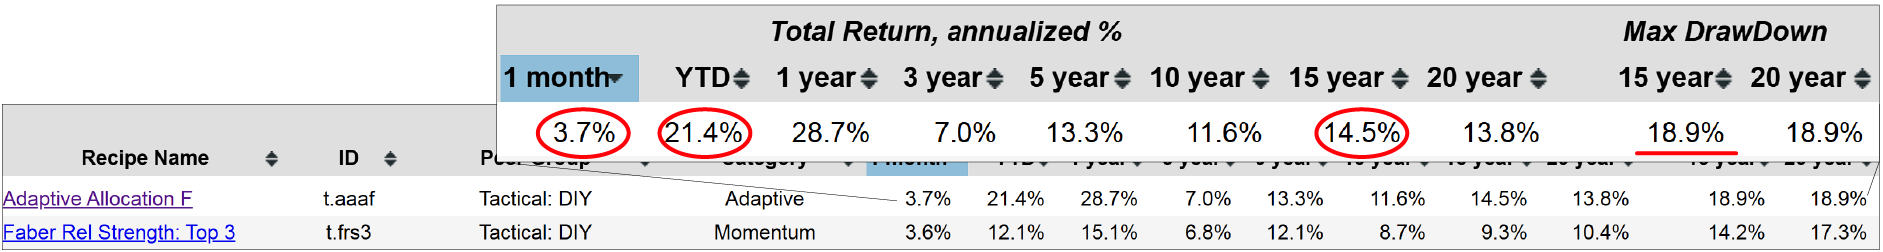
We just reviewed the Faber Relative Strength: Top 2, which is part of the tactical DIY portfolio category. The "t-dot" prefix denotes that it is a tactical portfolio recipe, meaning it may change monthly. In contrast, portfolio recipes that remain stable and do not change monthly are labeled with the "s-dot" prefix, indicating they are strategic. Among the tactical DIY portfolios, some have performed well recently. For example, Adaptive Allocation F (t.aaaf) has shown consistent performance and is favored by many subscribers. It has achieved a 3.7% return over the past month, over 21% over the past year, and a 14.5% return over the past 15 years, with a maximum drawdown of 18.9%. These figures highlight the strong performance of the Tactical Adaptive Allocation F portfolio, which is the sixth variation in this series, as indicated by the "f" suffix.
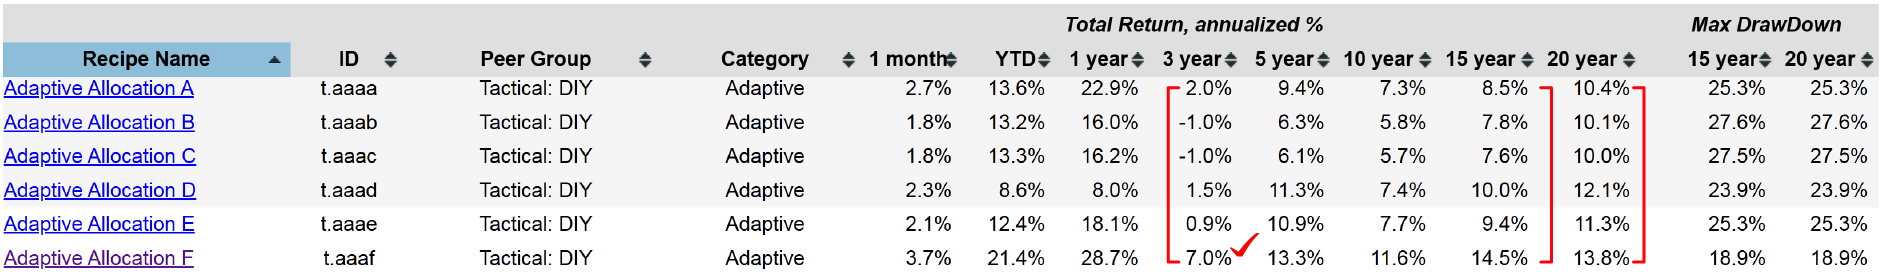
Investors can also sort by recipe name to view the six tactical asset allocation portfolios we have developed. These portfolios differ based on individual risk metrics and look-back periods. By selecting any of these portfolios, investors can access a description of how each algorithm operates. Over the past 20 years, these portfolios have shown similar results. However, their performance has diverged more over the past 15 years, and even more so over the past three years. For instance, while the Tactical Adaptive Allocation F has performed consistently well, some of the other portfolios have shown declines. This highlights the considerable variation among the adaptive allocation portfolios.
Strategic Allocation Portfolios: A Closer Look at Lazy Portfolios
Another area of interest is the "lazy" portfolios, a term used for static or strategic portfolios that maintain fixed allocations and do not change month to month. These portfolios have various origins. For example, the Lazy: Second Grader (s.seco), Lazy: No Brainer (s.nobr), Lazy: Coffeehouse (s.coff), and Lazy: Yale Unconventional (s.yale), which was modeled after Yale University's endowment investments. However, it's important to note that even though the Yale Unconventional portfolio may have mirrored the university's allocation years ago, it remains a static allocation and does not adapt to changes in the university's investment strategy. t is intriguing to examine the performance of this collection of lazy portfolios. For instance, the Lazy: Second Grader portfolio has achieved an 8.6% return over 20 years. However, this return comes with a substantial market risk, reflected by a 50% drawdown over the same period. This underscores the recurring theme of risk versus return, as illustrated by our scatterplots.
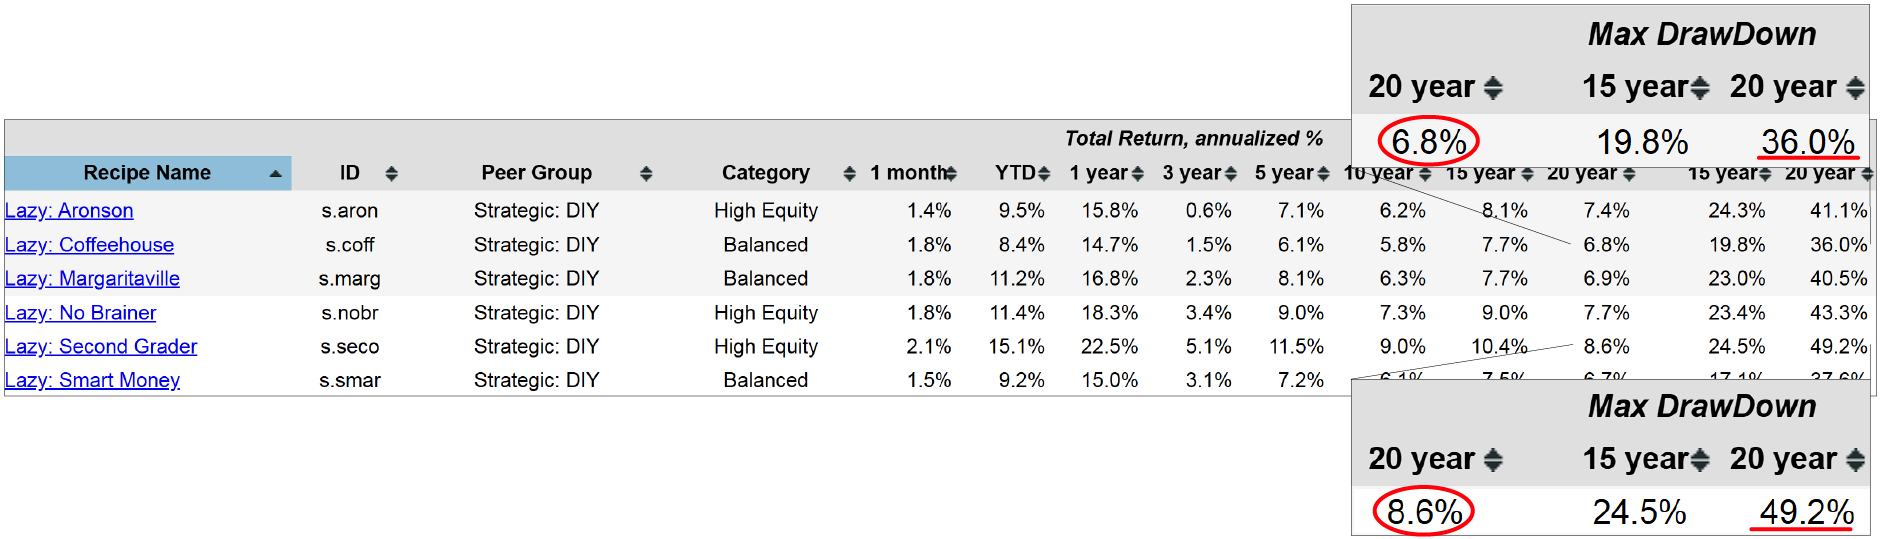
If the investor is interested in a straightforward, simple portfolio, comparing some of these lazy portfolios can be insightful. For example, the Lazy: Coffeehouse portfolio has achieved a 6.8% return with a 36% drawdown. This highlights the need to balance the risk-return trade-offs when choosing a portfolio.
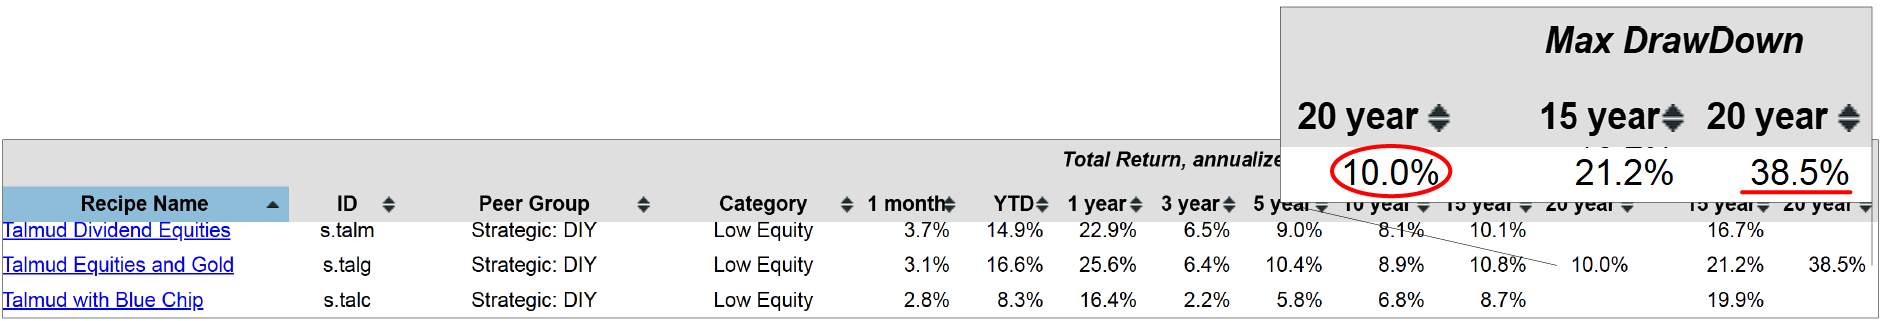
It's important to remember that all of these portfolios labeled with the "s-dot" prefix are static or strategic DIY portfolios. Although we don’t use the "lazy" prefix for all of them, these "s-dot" portfolios effectively function as lazy portfolios since they do not require monthly rebalancing. While the investors might adjust their core allocation on a monthly or quarterly basis, the allocation itself remains consistent. For example, the Talmud Equities and Gold (s.talg) portfolio has achieved a 10% annualized return over the past 20 years, despite a 38% drawdown. This demonstrates that some of these strategic portfolios have performed quite well, and they might be worth considering if the investors are looking for a more stable investment option.
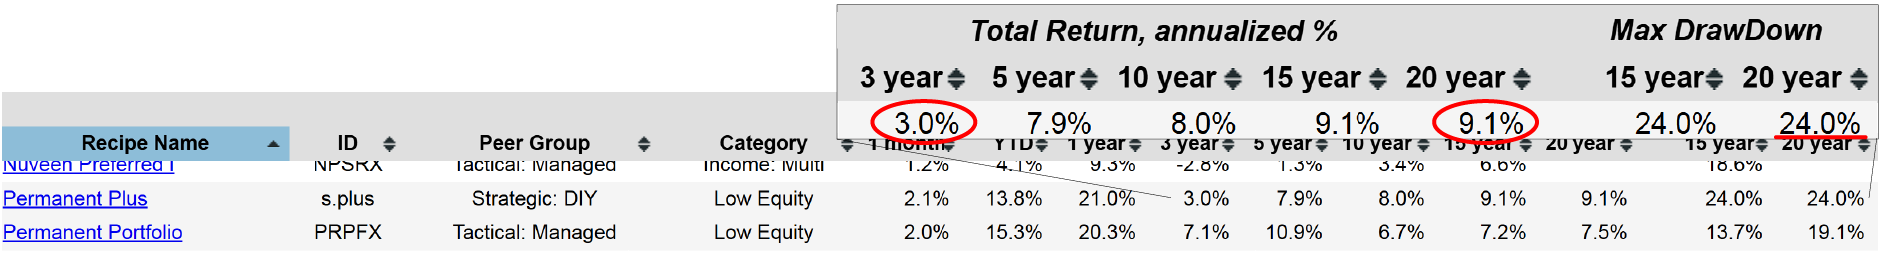
Some of these static, or strategic, portfolios become particularly intriguing when the investor considers their long-term performance. For instance, the Permanent Plus (s.plus) portfolio has delivered a 9.1% return over the past 20 years, with a 24% drawdown. However, it's important to note that these portfolios can have variable performance over shorter periods. For example, over the past three years, it has only achieved a 3% annual return. While not necessarily suited for those averse to volatility, many of these strategic portfolios have proven to be effective over the long term.