2024 Top Performing Portfolio Recipes t.srqr XCOR SPY s.plus
Top Performing Portfolio Recipes: Quartile Sector Rotation, FundX Upgrader, SPY Benchmark, and Permanent Plus Over 20 Years (Jul 2024)
Topics this month
- Quartile Sector Rotation (t.srqr): Continuing its Winning Streak
- FundX Upgrader (XCOR) Analysis and Comparison
- SPY (S&P 500) as a Benchmark for Performance Comparison
- Permanent Plus (s.plus) Strategy and Its Consistent Performance Over 20 Years
Welcome to the July 2024 commentary from recipeinvesting.com. We track investable portfolio recipes that allow investors and advisors to build portfolios that minimize risk and maximize return. We reallocate and rebalance monthly, so we have plenty of new material to cover for our comparisons this month.
Quartile Sector Rotation (t.srqr): Continuing its Winning Streak
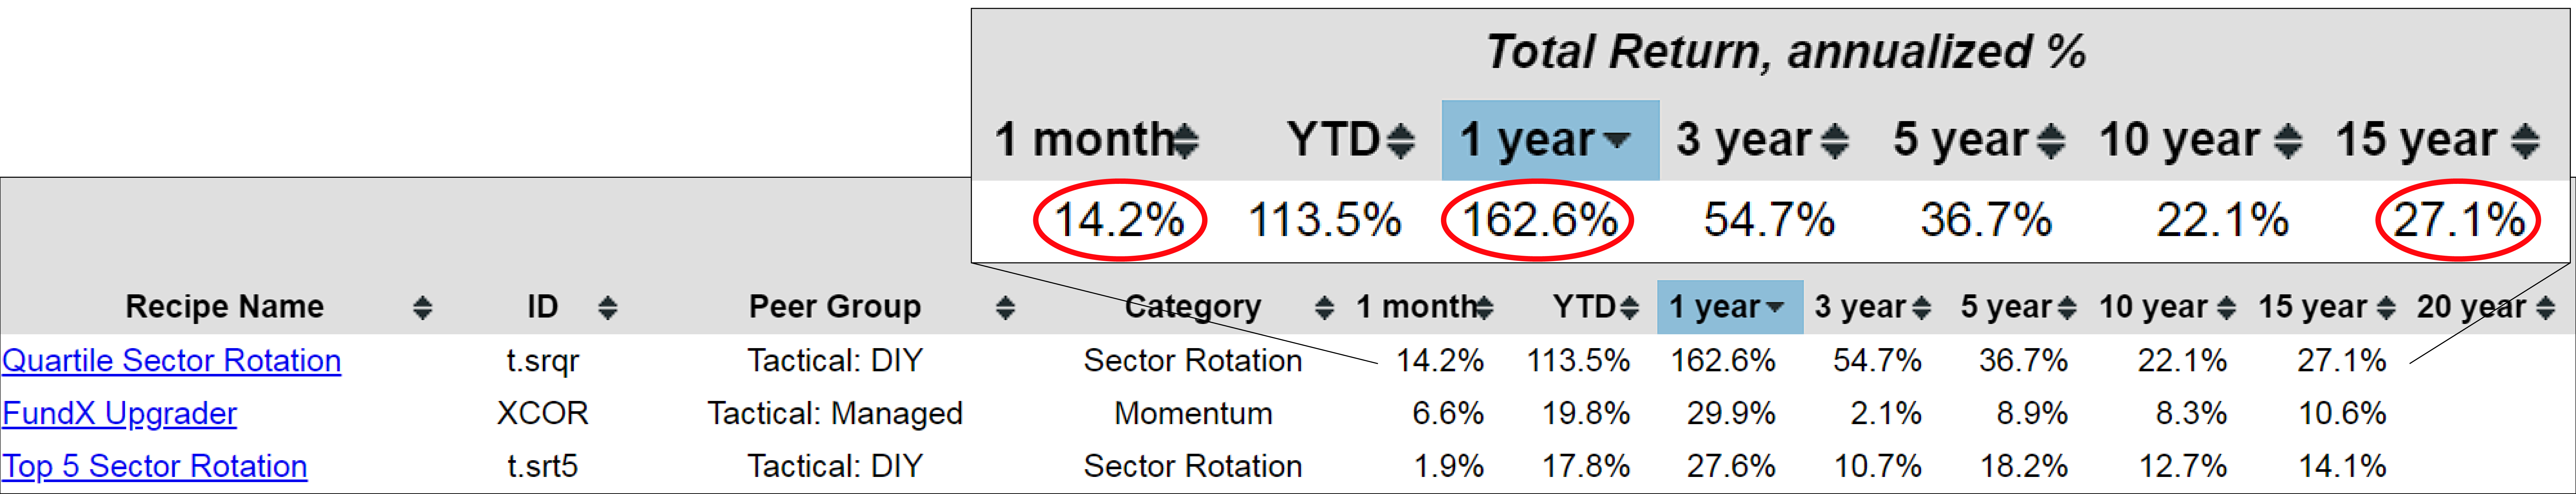
Let's examine all portfolio recipes. The scatter plot for risk versus return is provided. Evaluating the one-month total return rankings for all tracked portfolio recipes reveals that the Quartile Sector Rotation (t.srqr) continues its winning streak with a 14.2% monthly return. Over the past year, it has achieved an impressive 163% return. Annualized over 15 years, the return stands at 27.1%. This fund, though highly concentrated, has performed exceptionally well by rotating in and out of different sectors, hence the name Quartile Sector Rotation.
FundX Upgrader (XCOR) Analysis and Comparison
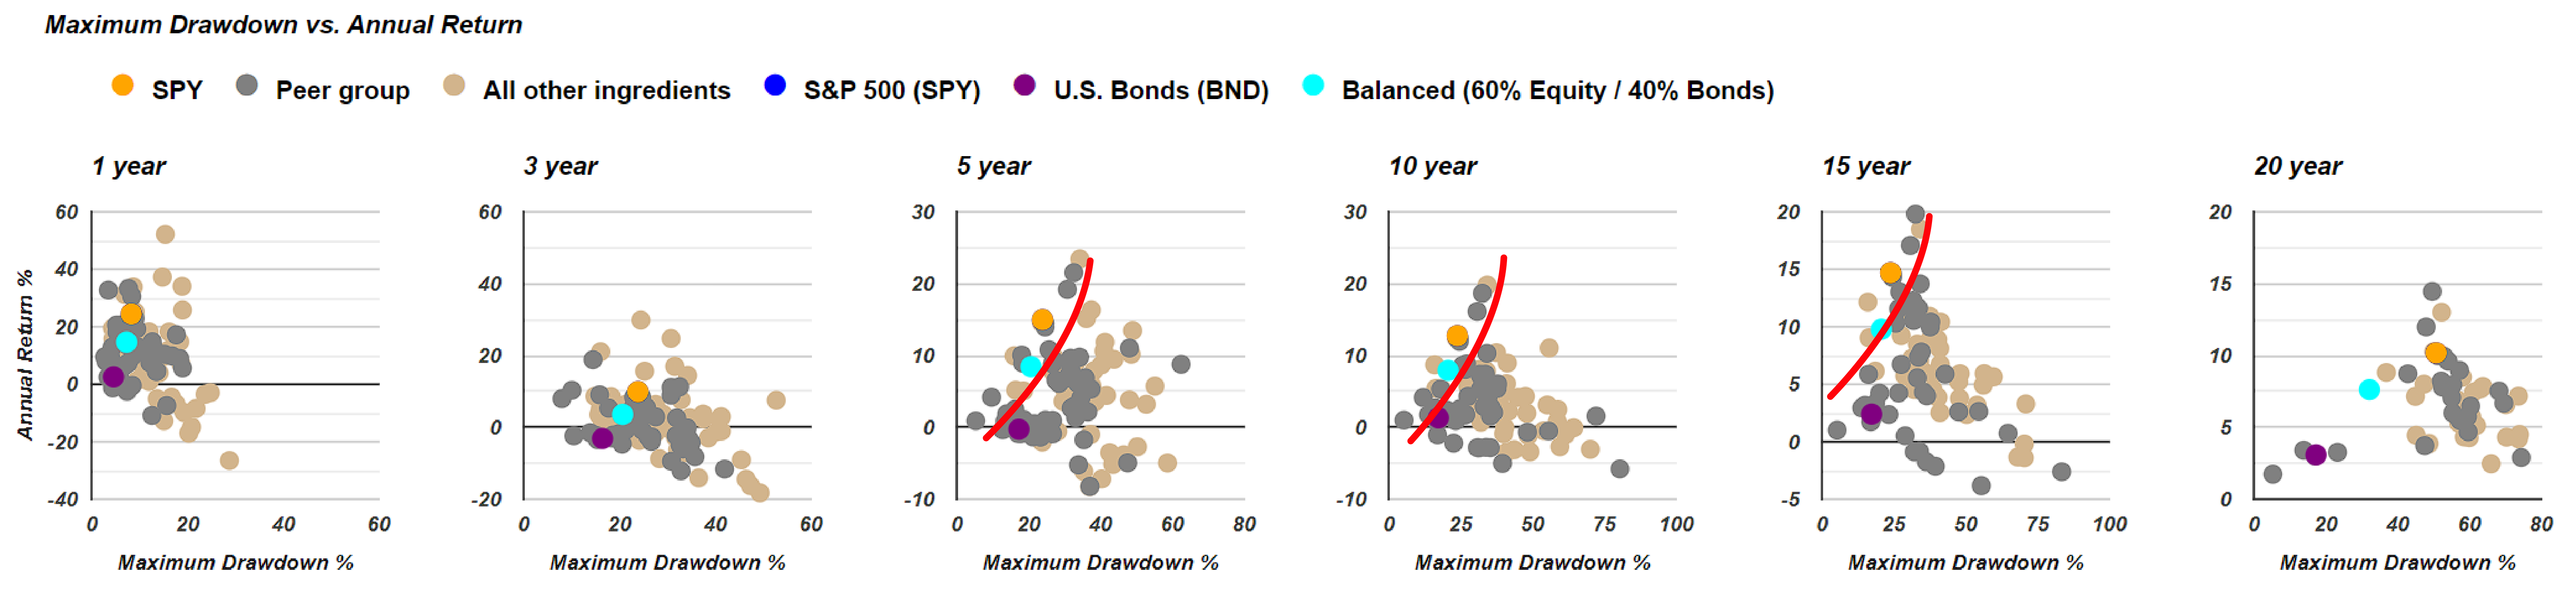
Let's examine a couple of other top performers in the one-month total return rankings. One notable entry is the FundX Upgrader, ticker XCOR. Comparing its risk versus return using scatterplots reveals that the orange dot, representing XCOR, is slightly above and to the right of the benchmark 60/40 balanced fund. Although there isn't 20 years of history for XCOR, the 15-year, 10-year, and 5-year data show that it generally offers higher risk and higher return. This trade-off may be favorable depending on individual investment preferences.
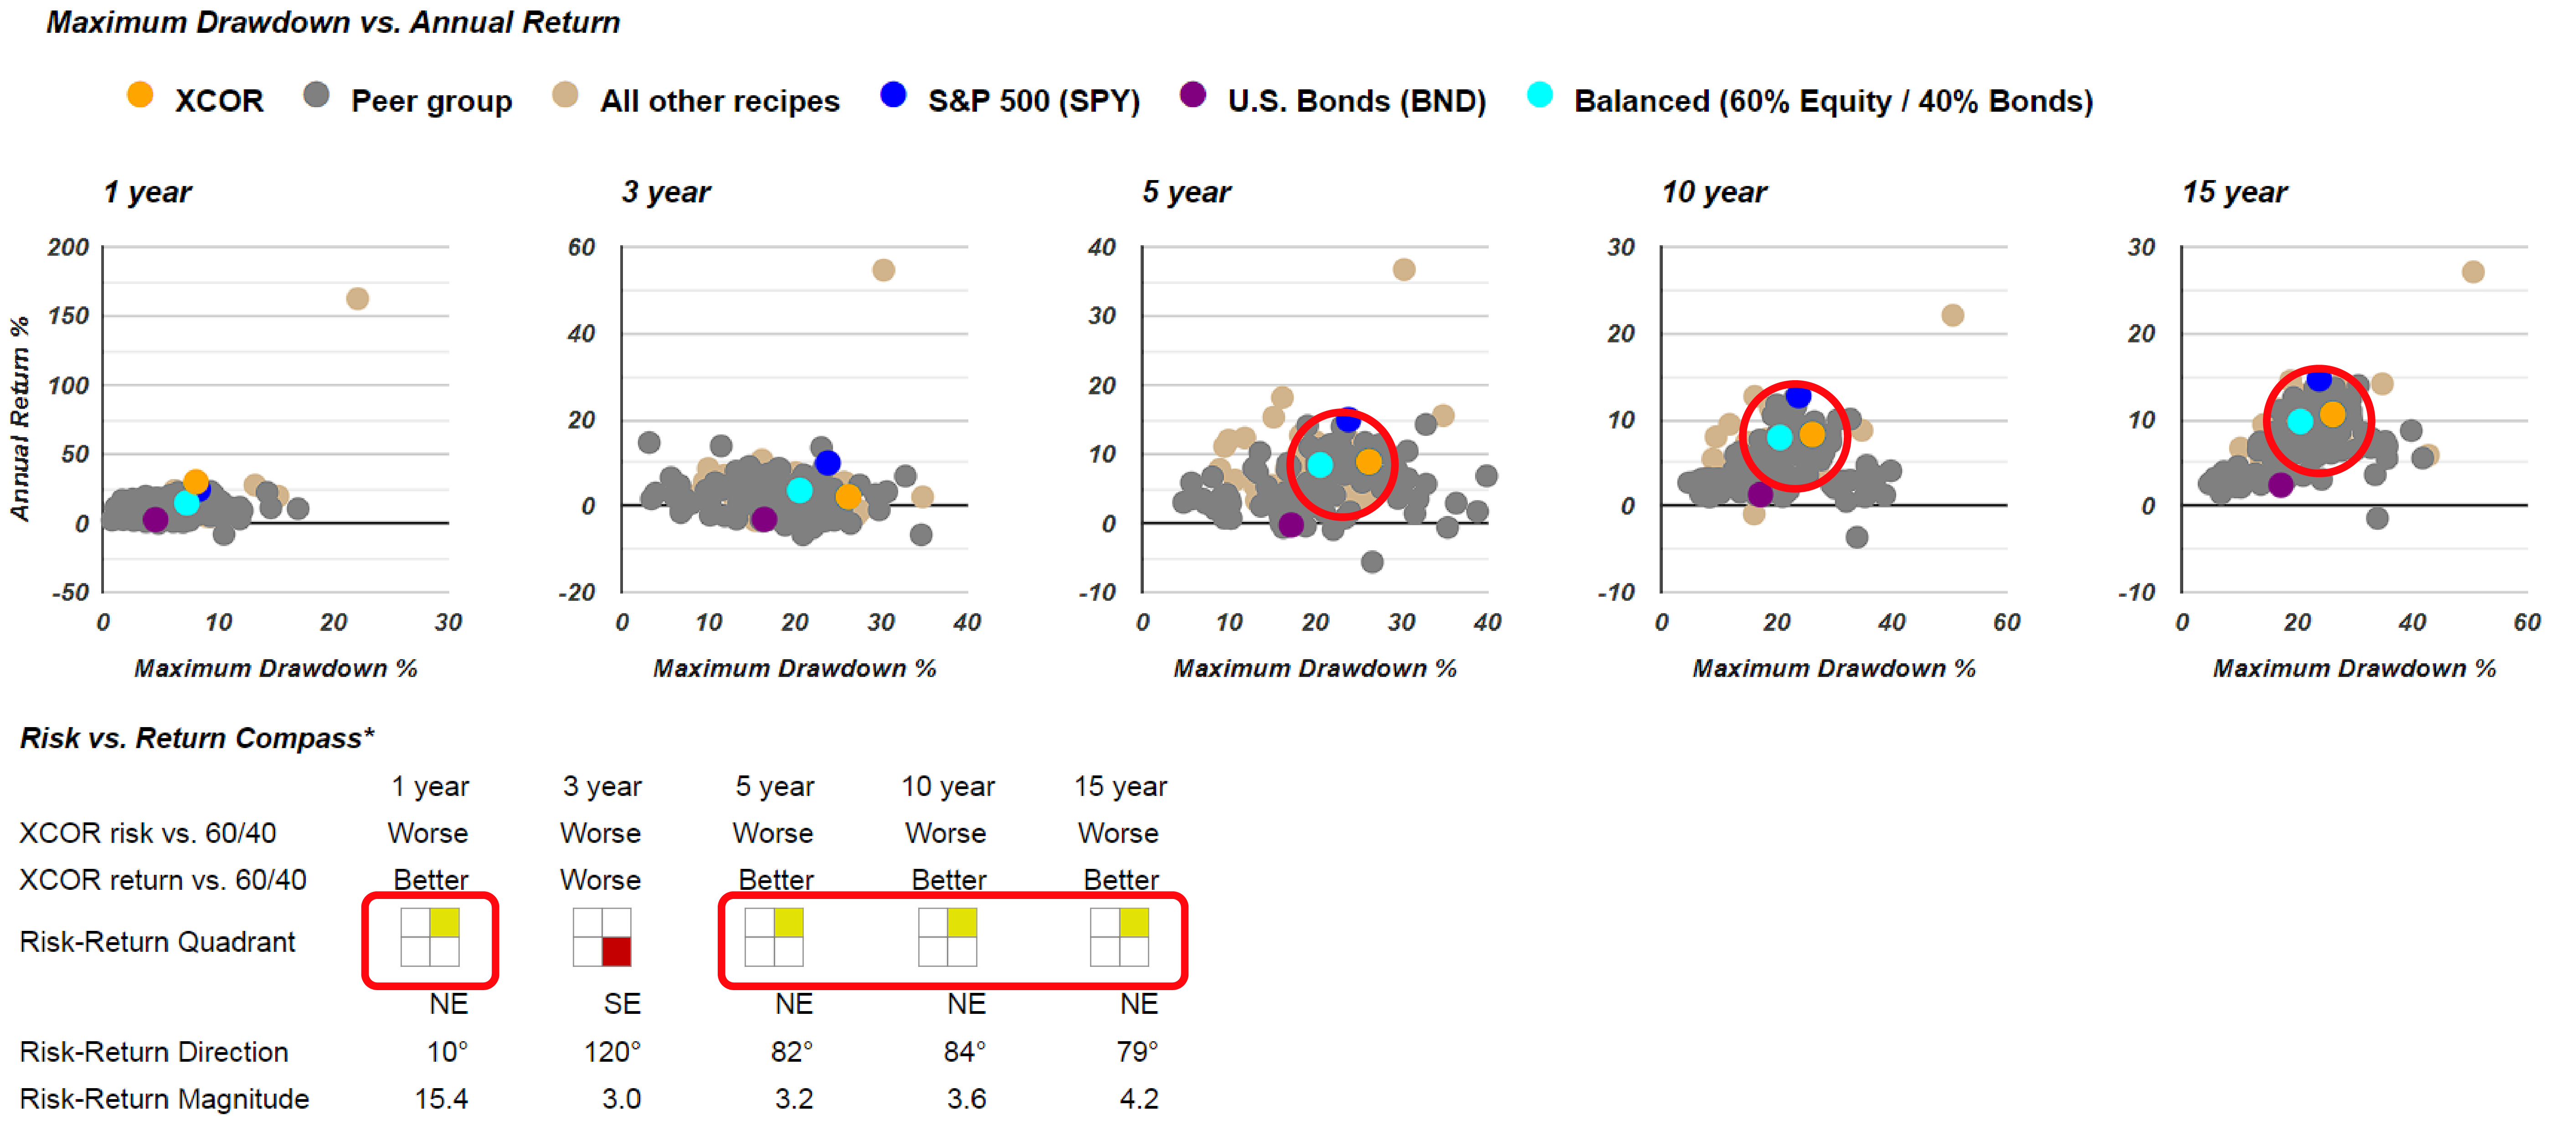
The risk versus return compass shows that in four out of five periods, XCOR is indicated with a yellow icon in the top right corner of the quadrant. This means that XCOR offers a higher risk but also a higher return compared to the benchmark 60/40 balanced fund.
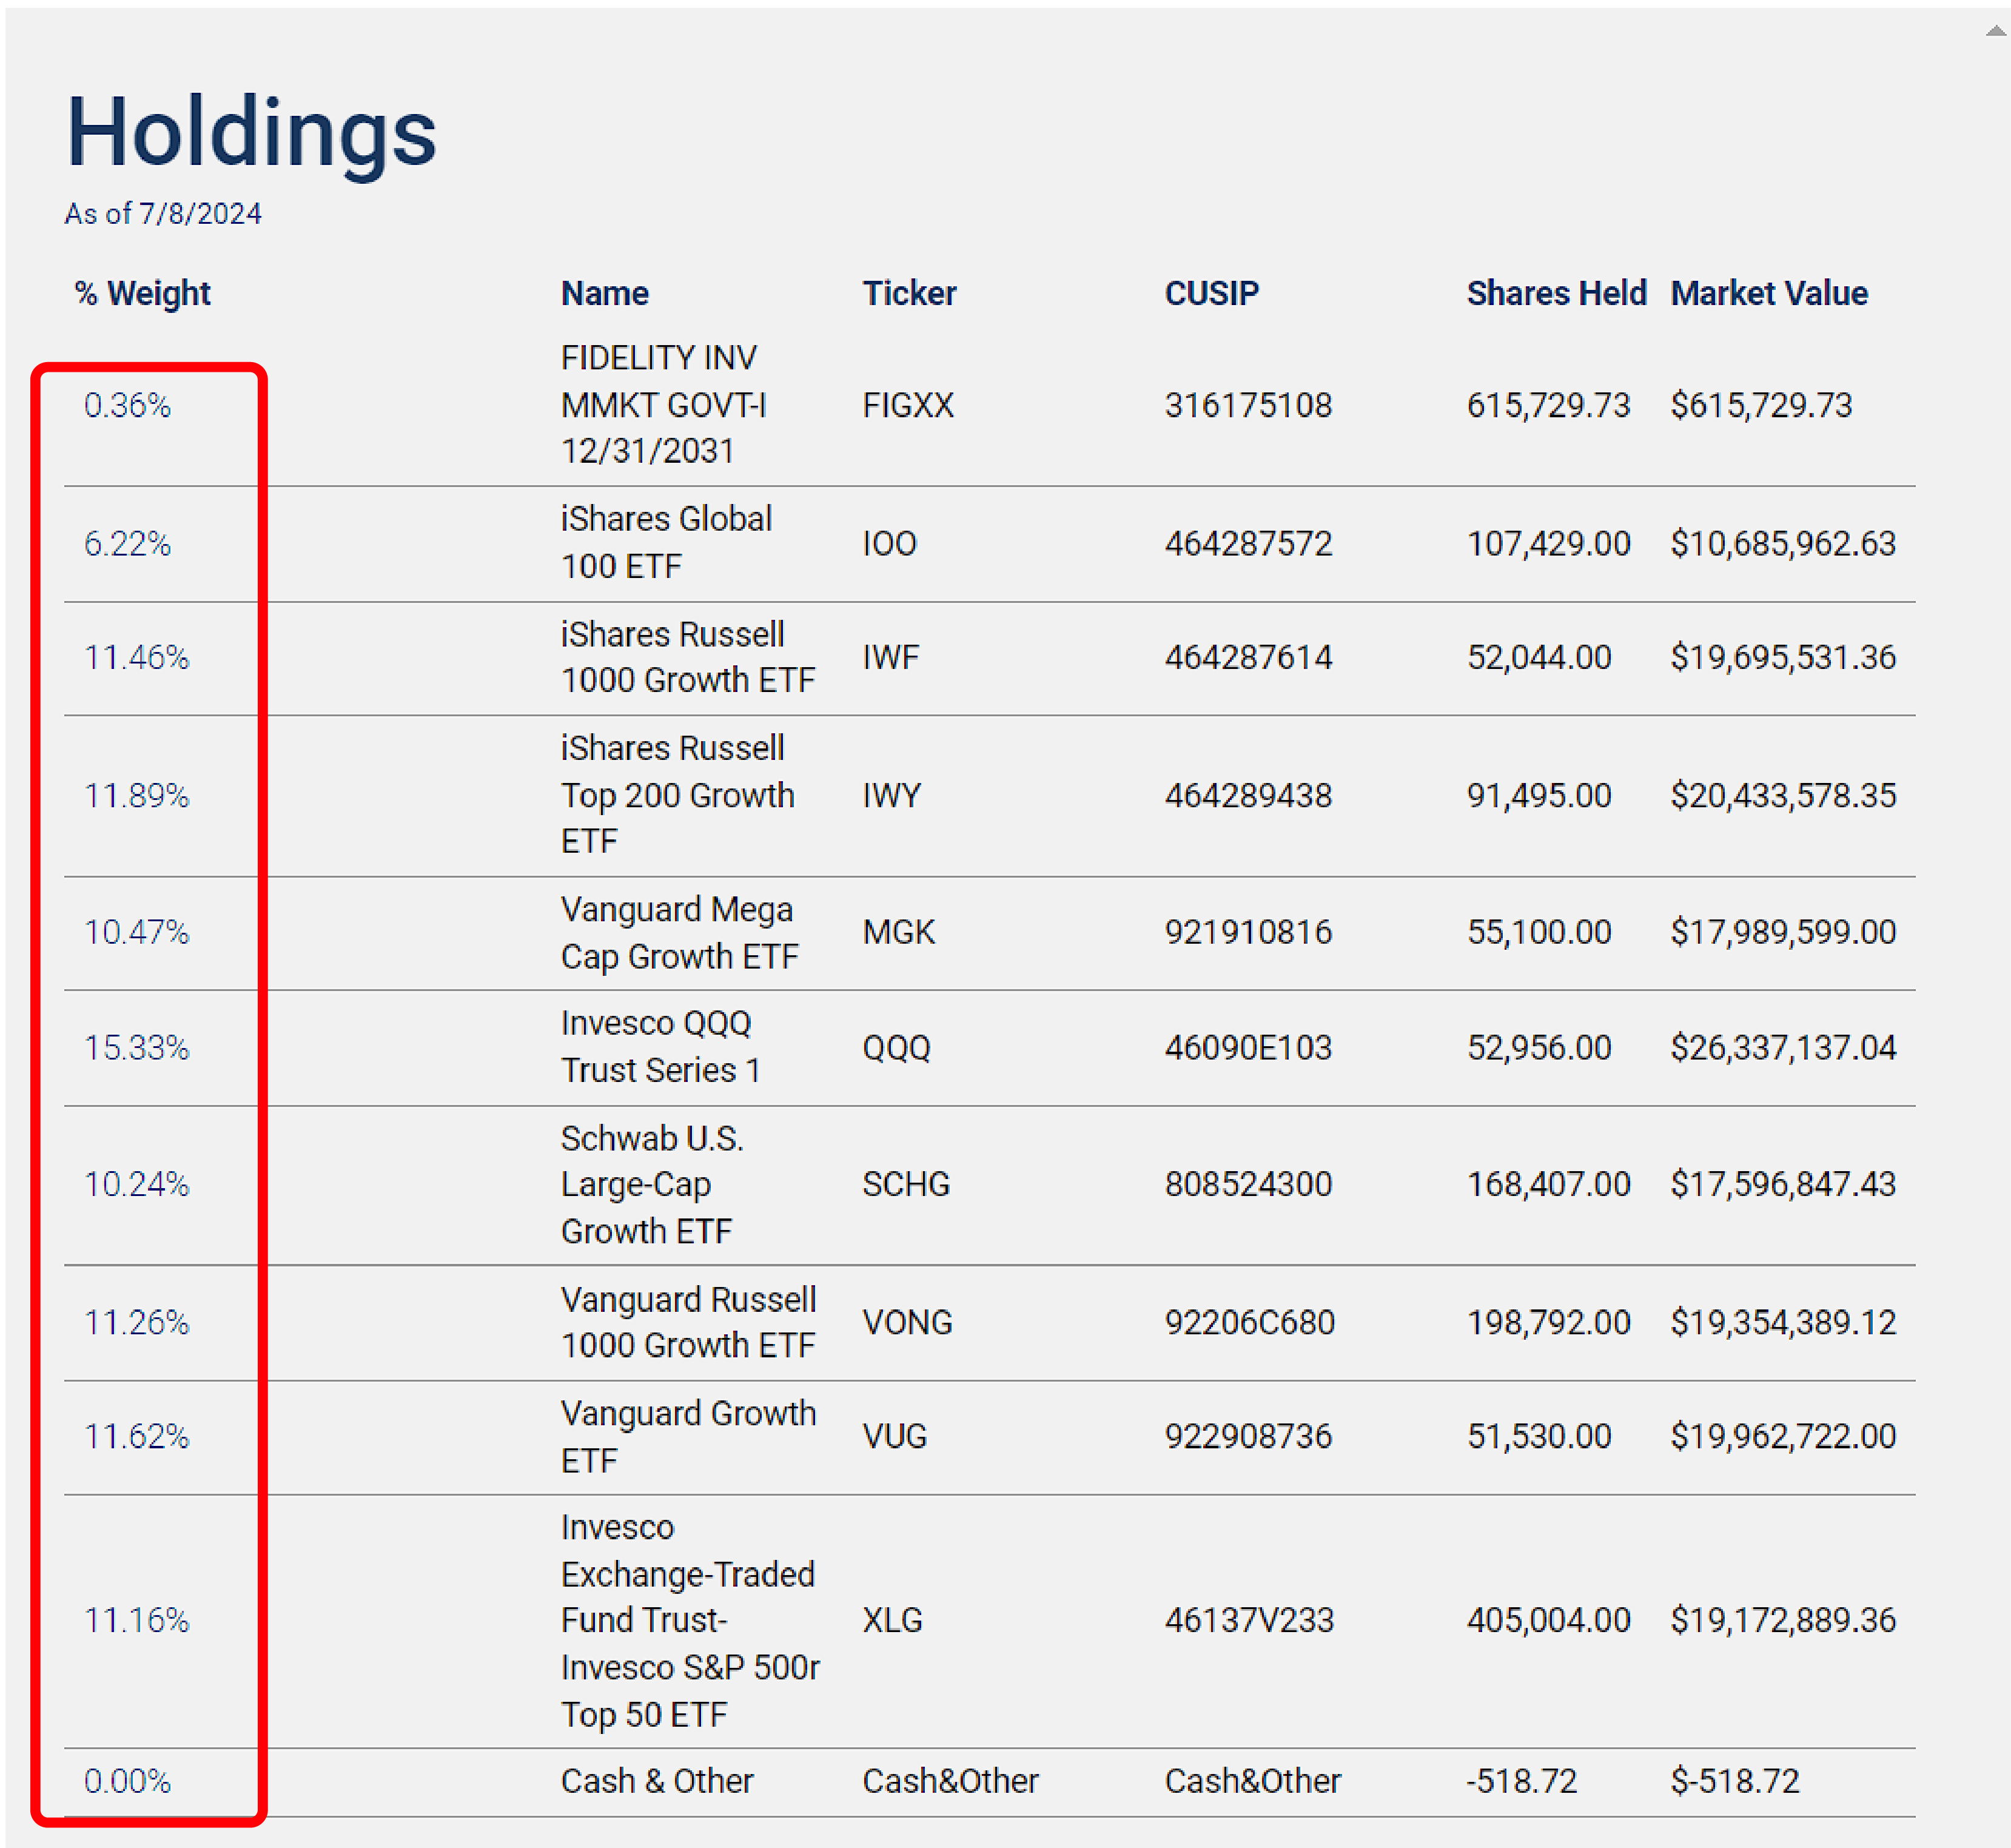
XCOR, formerly known as the FundX Upgrader Fund (FUNDX), is itself a type of portfolio recipe. It holds a variety of mutual funds or exchange-traded funds, weighted according to its own momentum-based algorithm. This makes it similar to the portfolio recipes provided by Recipe Investing. However, XCOR is an all-in-one fund of funds, designed to be a buy-it-once option. Its expense ratio is approximately 1.25% per year, which is slightly higher than purchasing the underlying funds directly. Nonetheless, XCOR handles all the buying and selling according to its algorithm, simplifying the investment process for its holders.
In the end, XCOR doesn't significantly outperform or offer more risk reduction compared to other options available, as indicated by those positioned above and to the left of the teal dot on the scatter plot. However, it's worth noting that the FundX Upgrader Fund, now known as XCOR, has been the top performer in the tactical managed category for the past month.
SPY (S&P 500) as a Benchmark for Performance Comparison
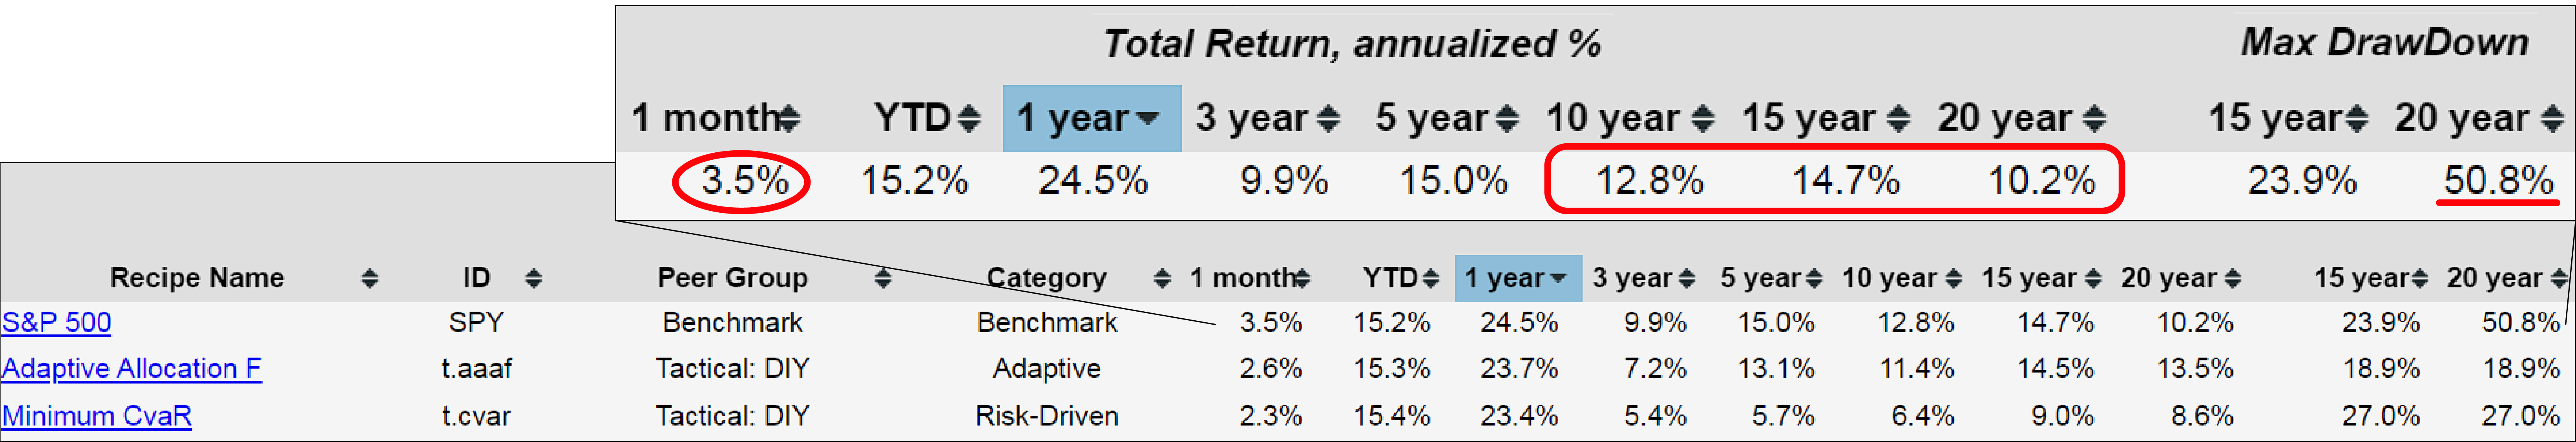
Let's continue by examining SPY, an ETF representing the S&P 500. Large-cap equities have performed well over the past month and, more broadly, over the past 15 to 20 years. This consistent performance is evident from the data. However, it's important to note that during the past 20 years, specifically around 2008 based on month-end returns, SPY experienced a decline of over 50%. This historical context highlights that while SPY has generally been a strong performer, it is not without risk.
Examining this benchmark further, on the risk versus return scatterplots, the investor can observe the orange dot representing the SPY ETF. This comparison shows that SPY performs quite favorably against other portfolio compositions. Although the past three years have shown some variability, with several portfolios outperforming SPY in terms of risk-adjusted return, the S&P 500 has still performed well overall during this period.
It's important to clarify that we're looking at individual exchange-traded funds (ETFs) rather than complete portfolio compositions. These ETFs represent single asset classes. The S&P 500 fund has consistently positioned itself along the efficient frontier across various periods, indicating its strong performance relative to other single-asset-class funds. This demonstrates the fund's ability to balance risk and return effectively over time.
Switching to the recipe summary page, investors can also examine the performance of the S&P 500, which is one of our default benchmarks represented by the blue dot. The SPY ETF is consistently shown as the blue dot across all these scatterplots. This allows for a clear visual comparison of the S&P 500's performance against other benchmarks over various periods.
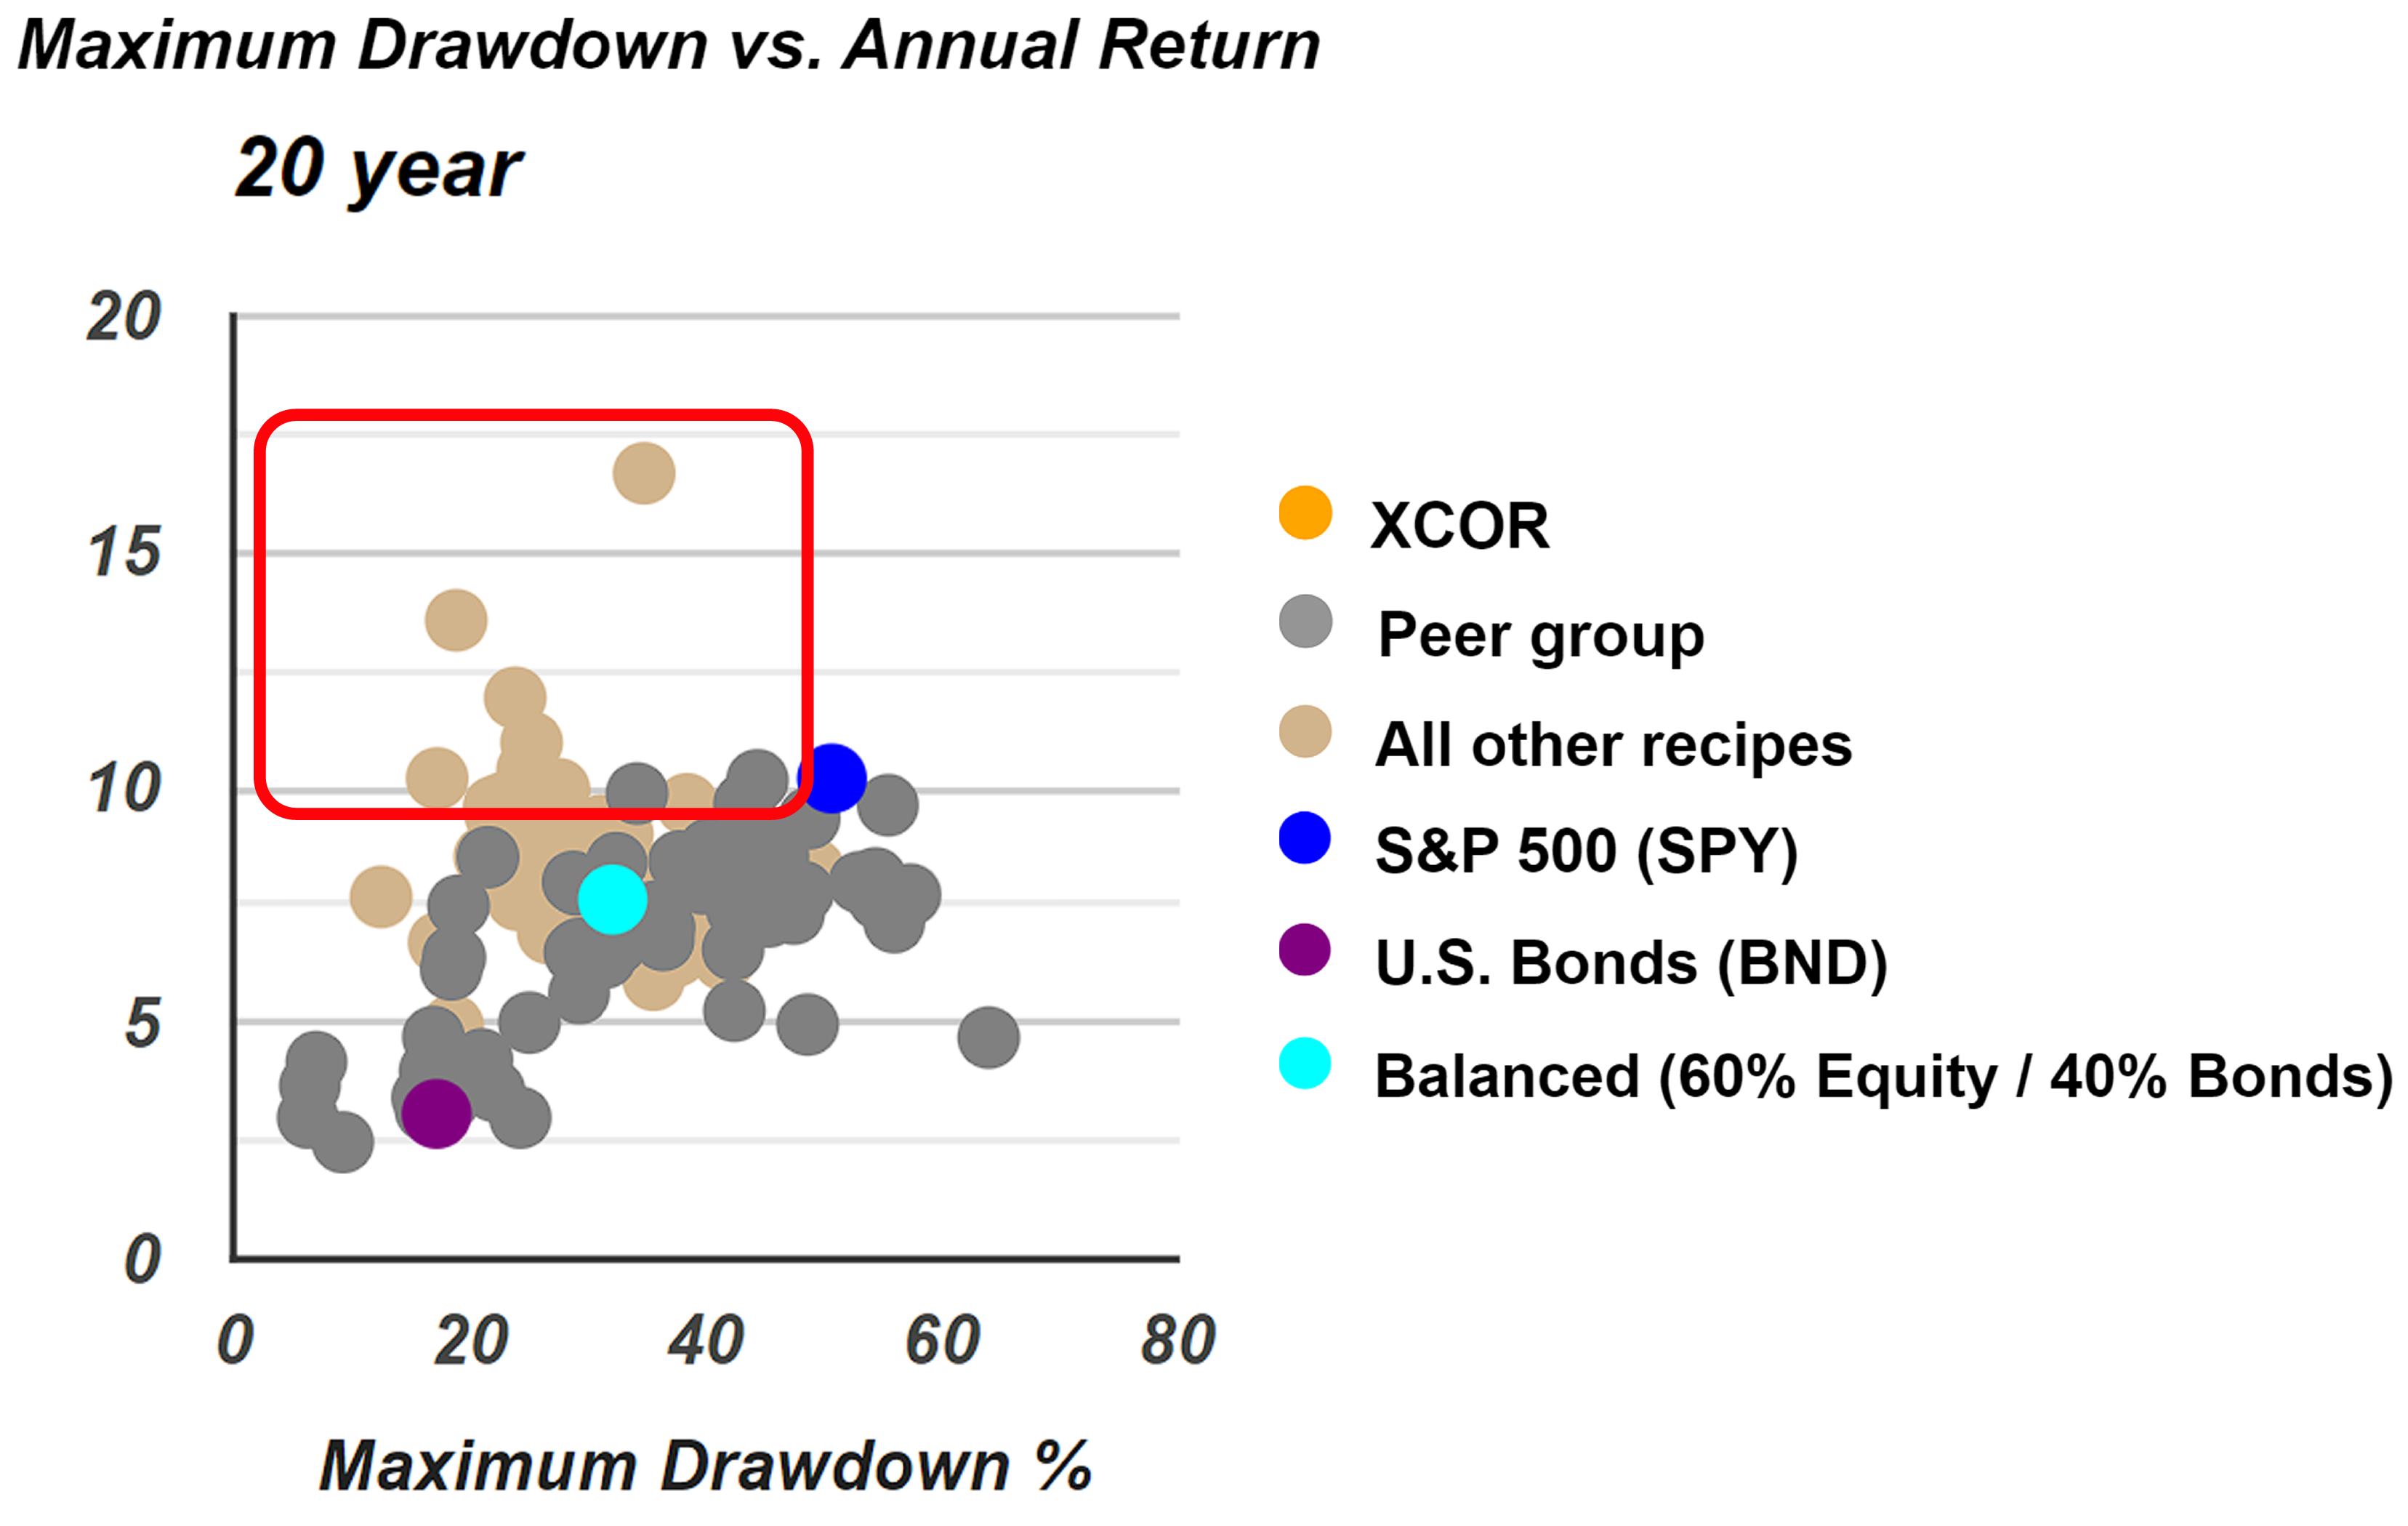
If the investor proceed to the FundX Upgrader to compare risk and return, they'll see the S&P 500 represented by a blue dot across various scatterplots, underscoring its value as a benchmark. In the 20-year timeframe, there are numerous portfolio recipes in this region that exhibit lower risk, as measured by maximum drawdown, and higher returns. These portfolios would be marked with a green icon in the risk versus return analysis, indicating their lower risk and higher return profiles compared to the S&P 500.
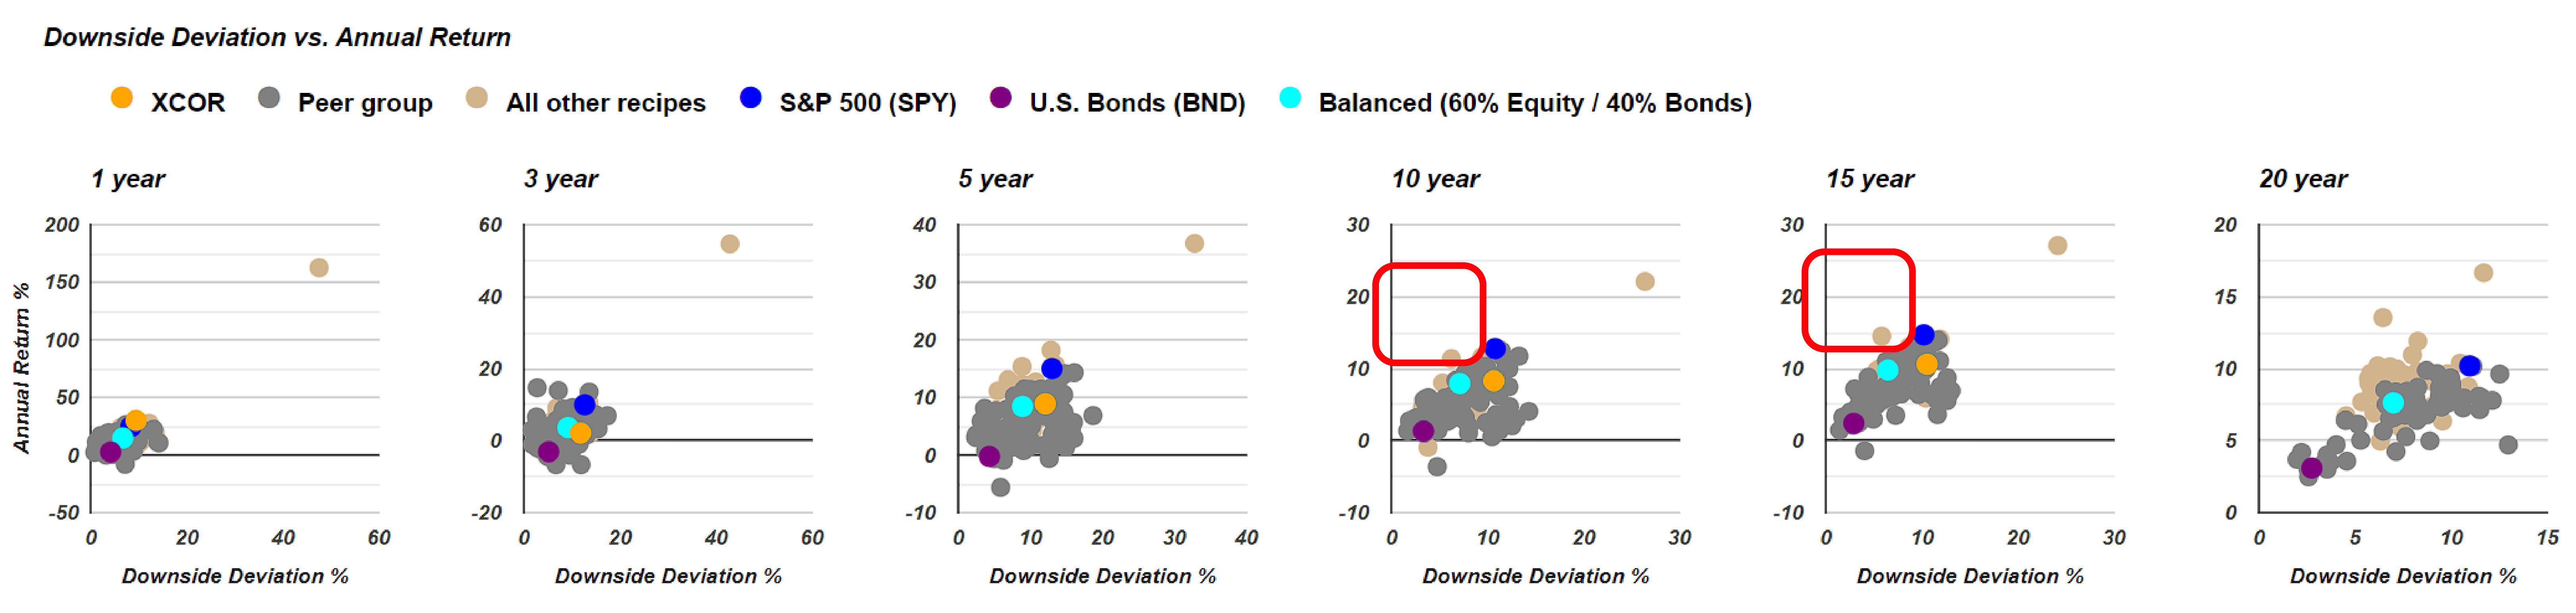
If the investor prefers not to use maximum drawdown, which measures the peak-to-trough decline at the end of any month and represents the most the investor could have lost on paper, they might consider downside deviation. Unlike standard deviation, downside deviation does not penalize for upside deviation, which is beneficial, but only for negative performance. Using this metric, they see several portfolio recipes in this cluster that have achieved better returns and lower risk. However, over the 15-year and 10-year periods, the cluster appears sparser, indicating that SPY has performed well during these timeframes. While SPY is a valuable benchmark for comparison, its performance varies across different periods, highlighting its relative strengths and weaknesses over short and long terms.
If the investor is willing to tolerate a bit more risk for potentially higher returns, the Quartile Sector Rotation has shown exceptional performance. Additionally, the Pure Momentum (t.pure) has exhibited outstanding returns over the 20-year period. However, it's important to note that we don't yet have the 20 years of historical data for t.srqr, so comparisons over such a long timeframe may not be fully accurate.
Permanent Plus (s.plus) Strategy and Its Consistent Performance Over 20 Years
Using SPY, the S&P 500 exchange-traded fund, as a benchmark for portfolio recipes provides valuable insights into performance comparisons. Now, let's consider another option: the Permanent Plus (s.plus). If the investor scan down the IDs, they'll notice that any ticker with a "t." suffix indicates a tactical portfolio, while those with specific tickers represent tactically managed funds, such as professionally managed ETFs or mutual funds. Examining further, the first "s." suffix they see for the current month shows a 2.8% return. The Permanent Plus is a low-equity recipe based on the permanent portfolio, offering a diversified approach with stable returns.
Examining the Permanent Plus, investors can see a brief description explaining that it is based on Harry Browne's Permanent Portfolio, which traditionally consists of gold, long-term treasury bonds, stocks, and cash. However, the Permanent Plus removes the cash component. The reasoning behind this adjustment is that while cash does reduce risk slightly, it significantly drags down returns without providing enough risk reduction to justify its inclusion. Therefore, the "s.plus" comprises only three of the four original components—gold, long-term treasury bonds, and stocks. Interestingly, maintaining these three exchange-traded funds in the same ratio has yielded consistent performance over the past 20 years.
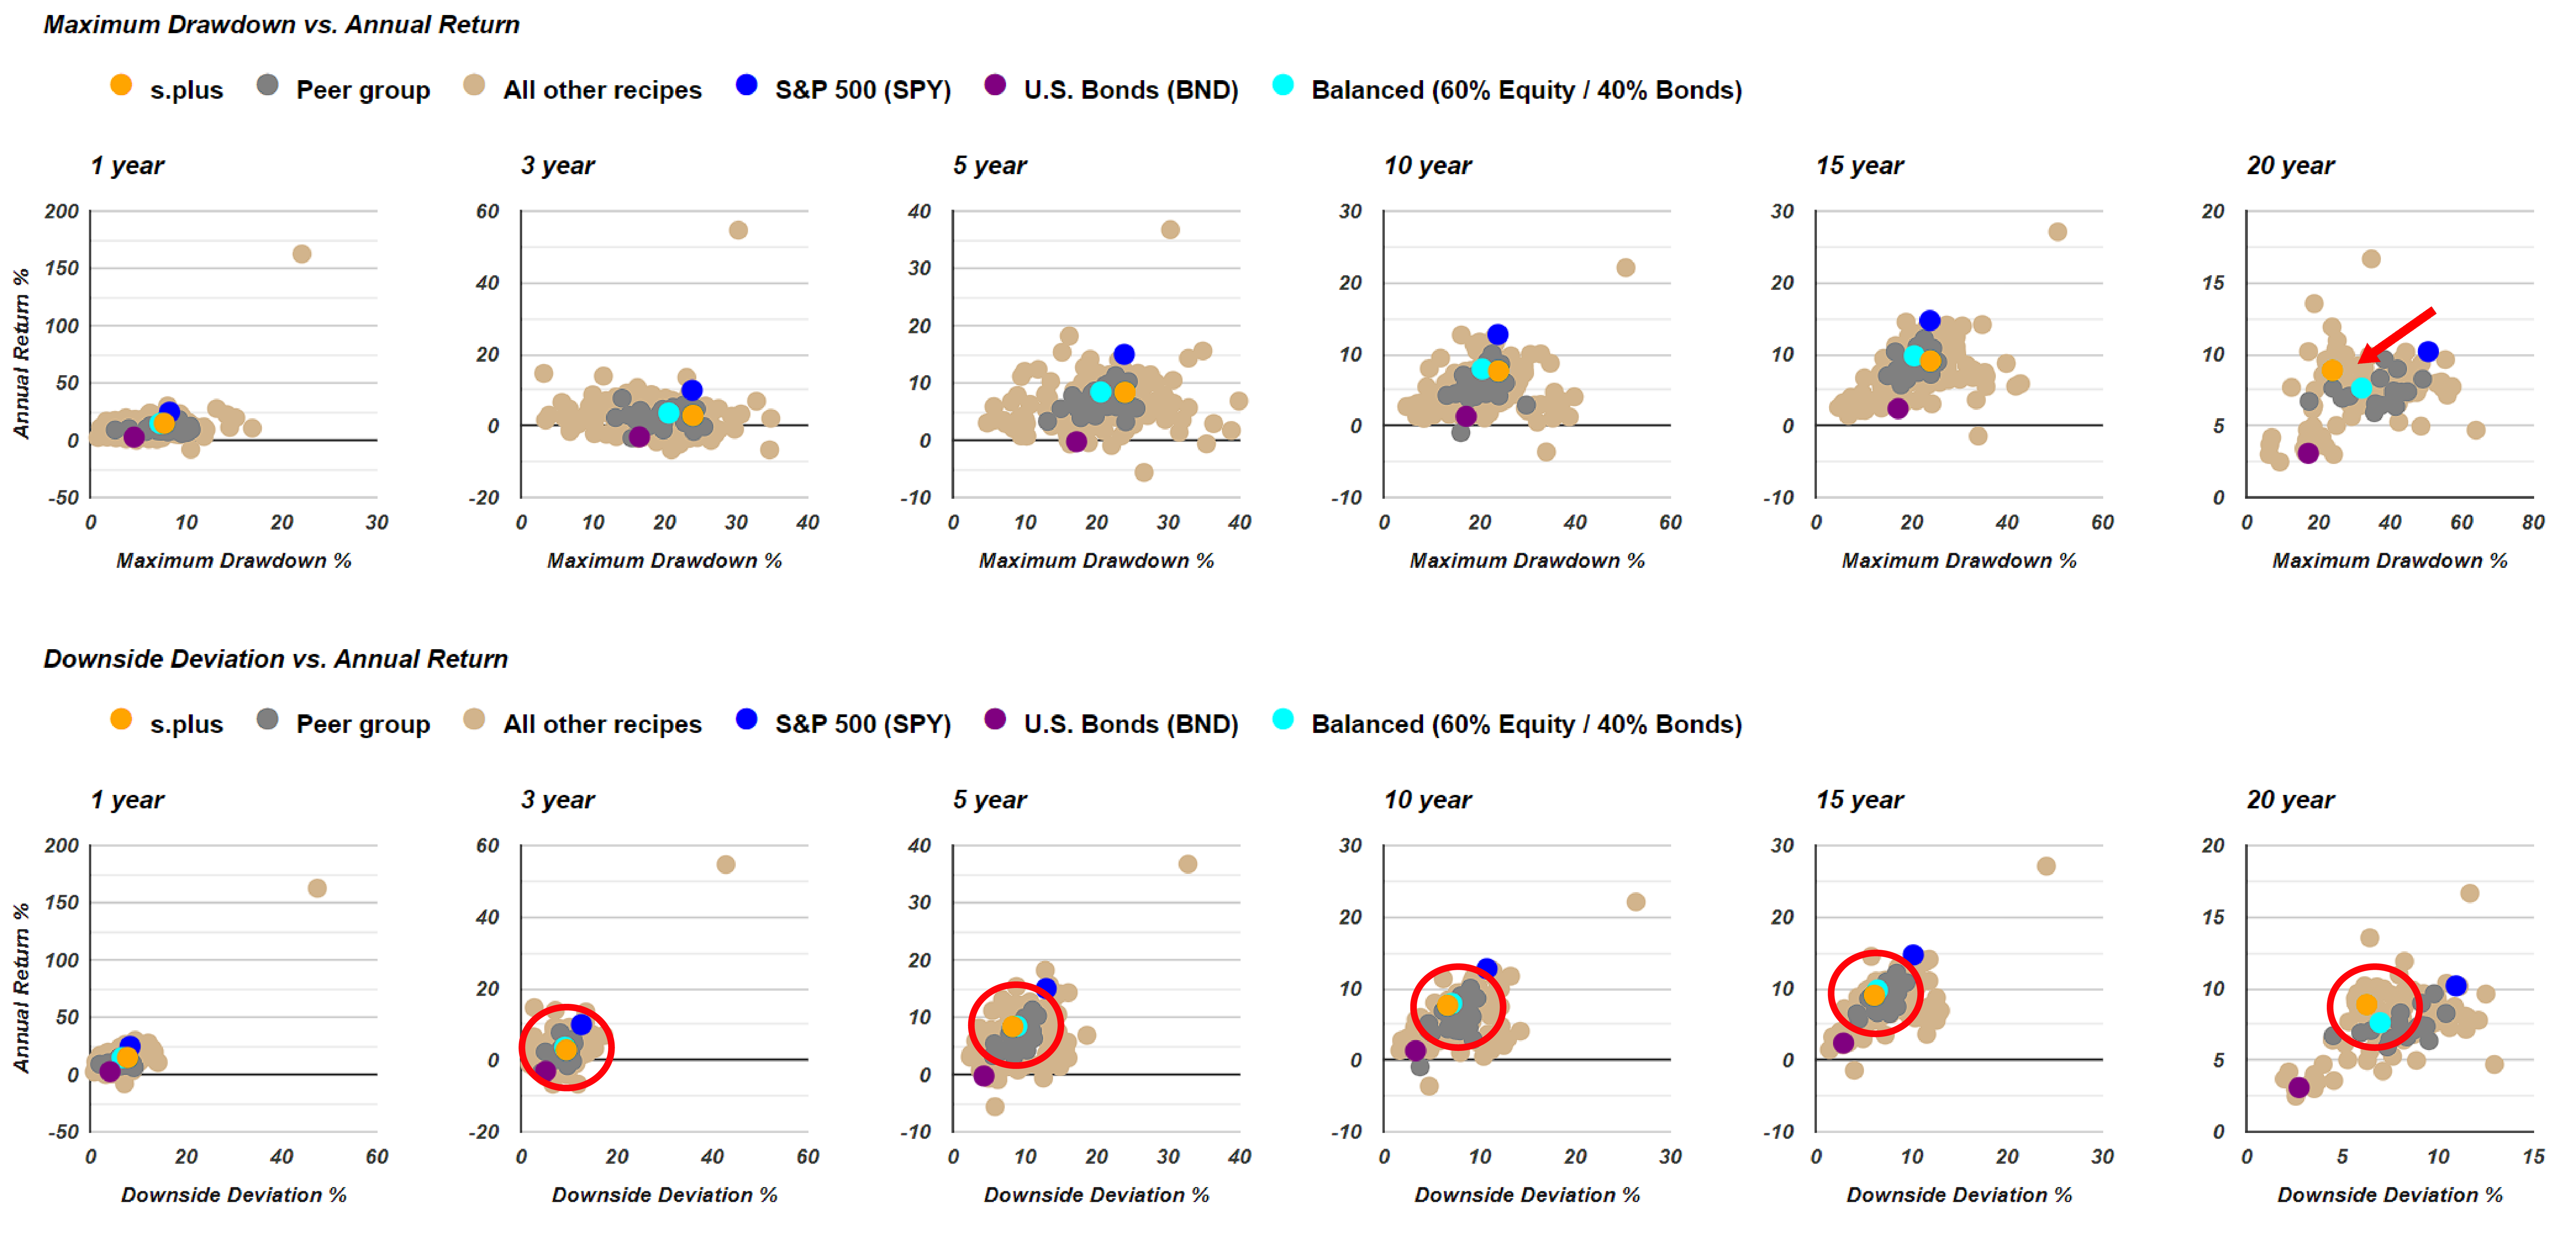
Over the 20-year timeframe, the orange dot representing the Permanent Plus has outperformed the teal dot, which represents the 60/40 balanced fund benchmark. Despite having a slightly higher risk, as measured by maximum drawdown, the s.plus has consistently delivered better returns. When comparing downside deviation, the teal and orange dots are closely positioned across various time periods, indicating similar risk-adjusted performance. This demonstrates that the s.plus, even without the cash component of the original Harry Browne's Permanent Portfolio, has been a robust performer.
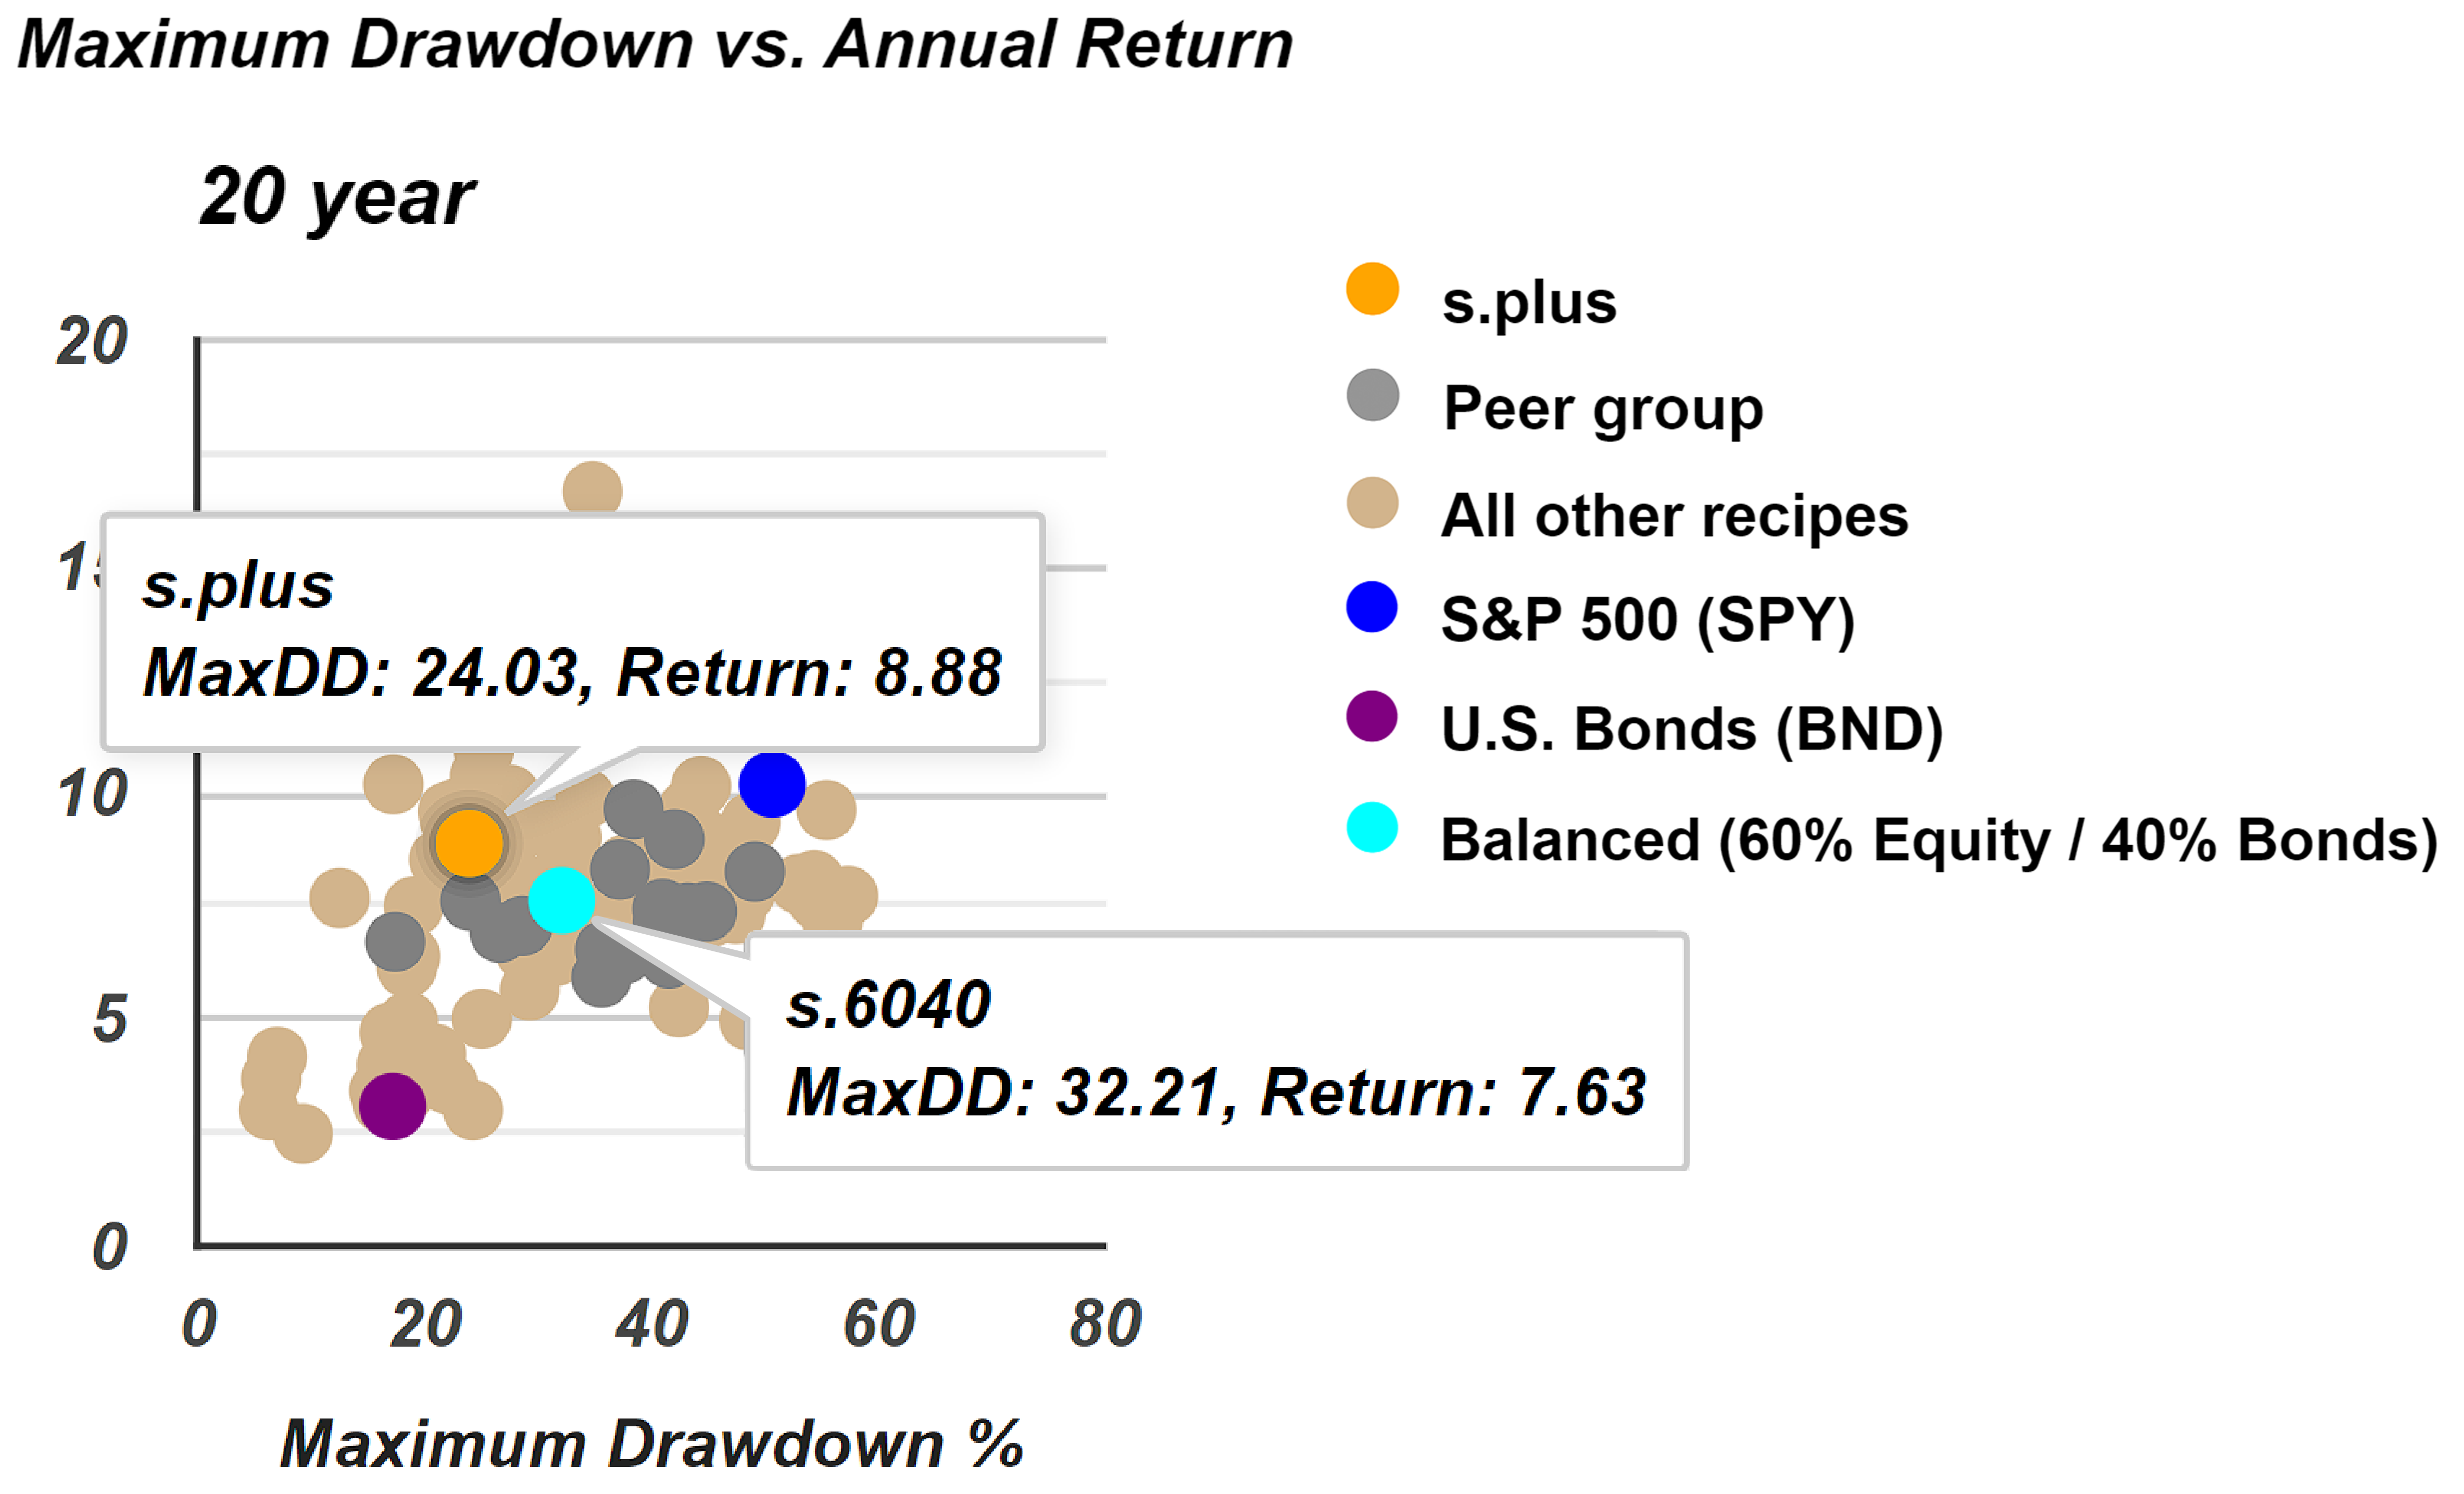
It's quite interesting that the Permanent Plus, which consists of three exchange-traded funds (ETFs) in equal measures—Gold (GLD), IWF (an equity fund), and TLT (a long-term bond fund)—has performed similarly to a 60/40 balanced fund consisting of just equities and bonds. By adding gold as the third component, the s.plus has delivered better returns over the past 20 years. When we hover over the data, we see that the s.plus has achieved an annualized return of 8.88%, compared to 7.63% for the 60/40 balanced fund, represented by the teal dot. This over 1% annualized return difference is significant, demonstrating the effectiveness of the s.plus portfolio recipe.
This month, we've reviewed our portfolio recipes, highlighting several standout performers. The Quartile Sector Rotation (t.srqr) continues to show exceptional performance, despite its high concentration and associated risks. The FundX Upgrader (XCOR) remains one of the top tactical managed portfolio recipes. We've discussed using SPY as a benchmark for performance comparison. Finally, we examined the Permanent Plus (s.plus), which has not only performed well over the past month but has also demonstrated remarkable consistency over the past 20 years. This recipe, based on equal allocations in gold (GLD), IWF (equity fund), and TLT (long-term bond fund), has even outperformed the 60/40 balanced fund benchmark.