2025 Country Funds, Sortino Ratio, Vanguard, & Sector Rotation Trade-Offs
Country Funds, Sortino Ratio, Vanguard, & Sector Rotation Trade-Offs (Apr 2025)
Topics this month
- Performance updates on Country-specific funds (Poland, Greece, Norway)
- Sortino Ratio & Long-Term Insights: Explanation of the Sortino Ratio & High-performing portfolios over 15–20 years
- Mutual & Vanguard Funds with Strong Risk-Adjusted Returns
- Comparing Sortino Ratios Across Sample Portfolios
- Trade-Offs of Sector Rotation Funds
Recipe Investing offers a variety of portfolio strategies, or “recipes,” each constructed from core components known as ingredients (typically ETFs, though some portfolios also incorporate mutual funds). By reviewing the Ingredients page, investors can compare fund performance across different timeframes.
When sorted by one-month returns, the data shows that several asset classes faced challenges recently. Reversing the order, however, highlights the strongest performers – many of which are country-specific funds.
Country-Specific Standouts
A few of this month’s top-performing country funds include:
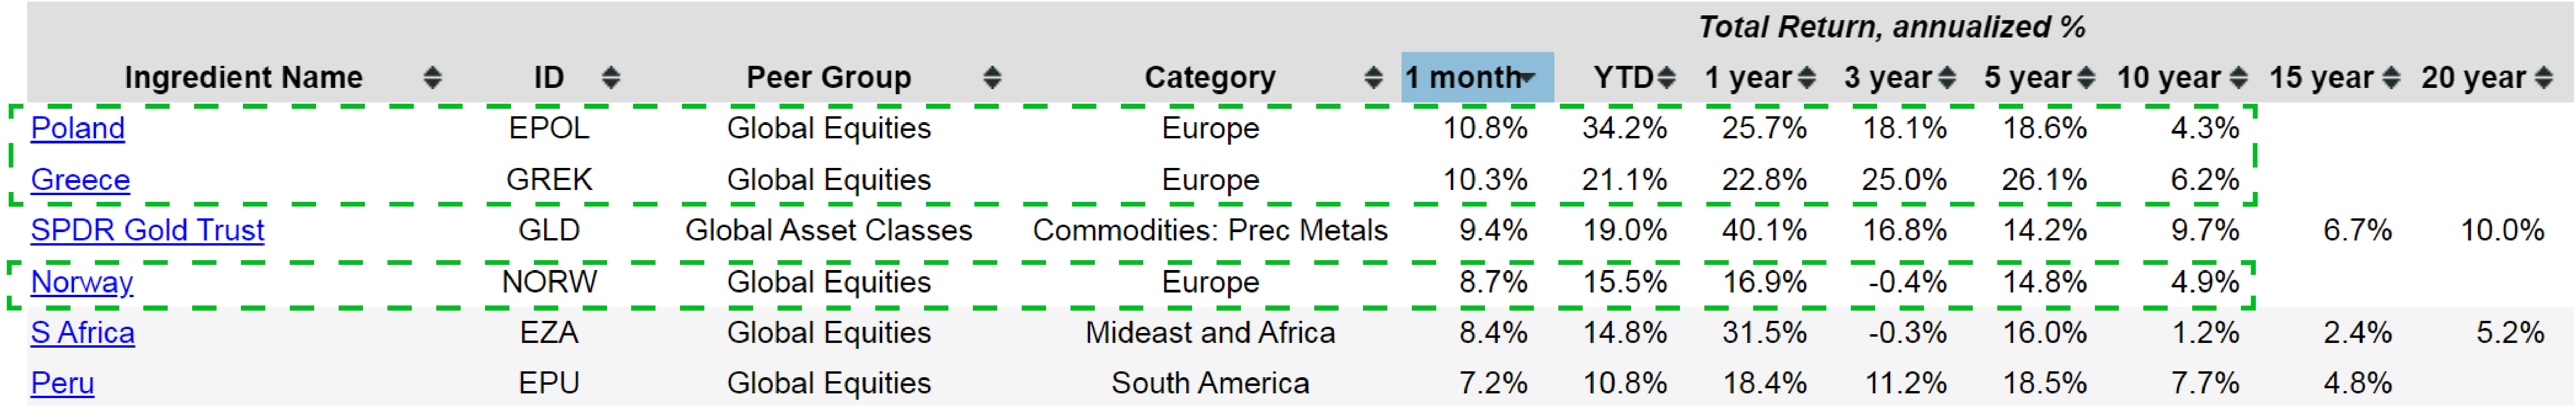
Poland, in particular, has shown notable resilience, delivering nearly 11% in one-month returns despite a modest 4.3% annualized return over a 10-year period. Recipe Investing data operates with a slight lag—around ten days after month-end—so cross-referencing more current sources (like Google Finance) can confirm short-term performance trends.
The Sortino Ratio: A Key Risk-Adjusted Metric
To understand performance in greater detail, investors often look beyond raw returns and focus on the Sortino ratio. This metric calculates:
$$ \text{Sortino Ratio} = \frac{R_p - R_f}{\text{DD}} $$
Where:
- Rp = portfolio return
- Rf = risk-free rate
- DD = downside deviation
Unlike standard deviation, the Sortino ratio doesn’t penalize a fund for positive volatility. Instead, it reveals how much return is earned per unit of downside risk, making it especially relevant for investors seeking balanced growth with limited drawdowns.
Long-Term Sortino Ratio Observations
A dedicated section on the platform shows Sortino ratios for intervals such as 7, 10, 15, and 20 years. Longer periods tend to smooth out market fluctuations and offer more stable insights.
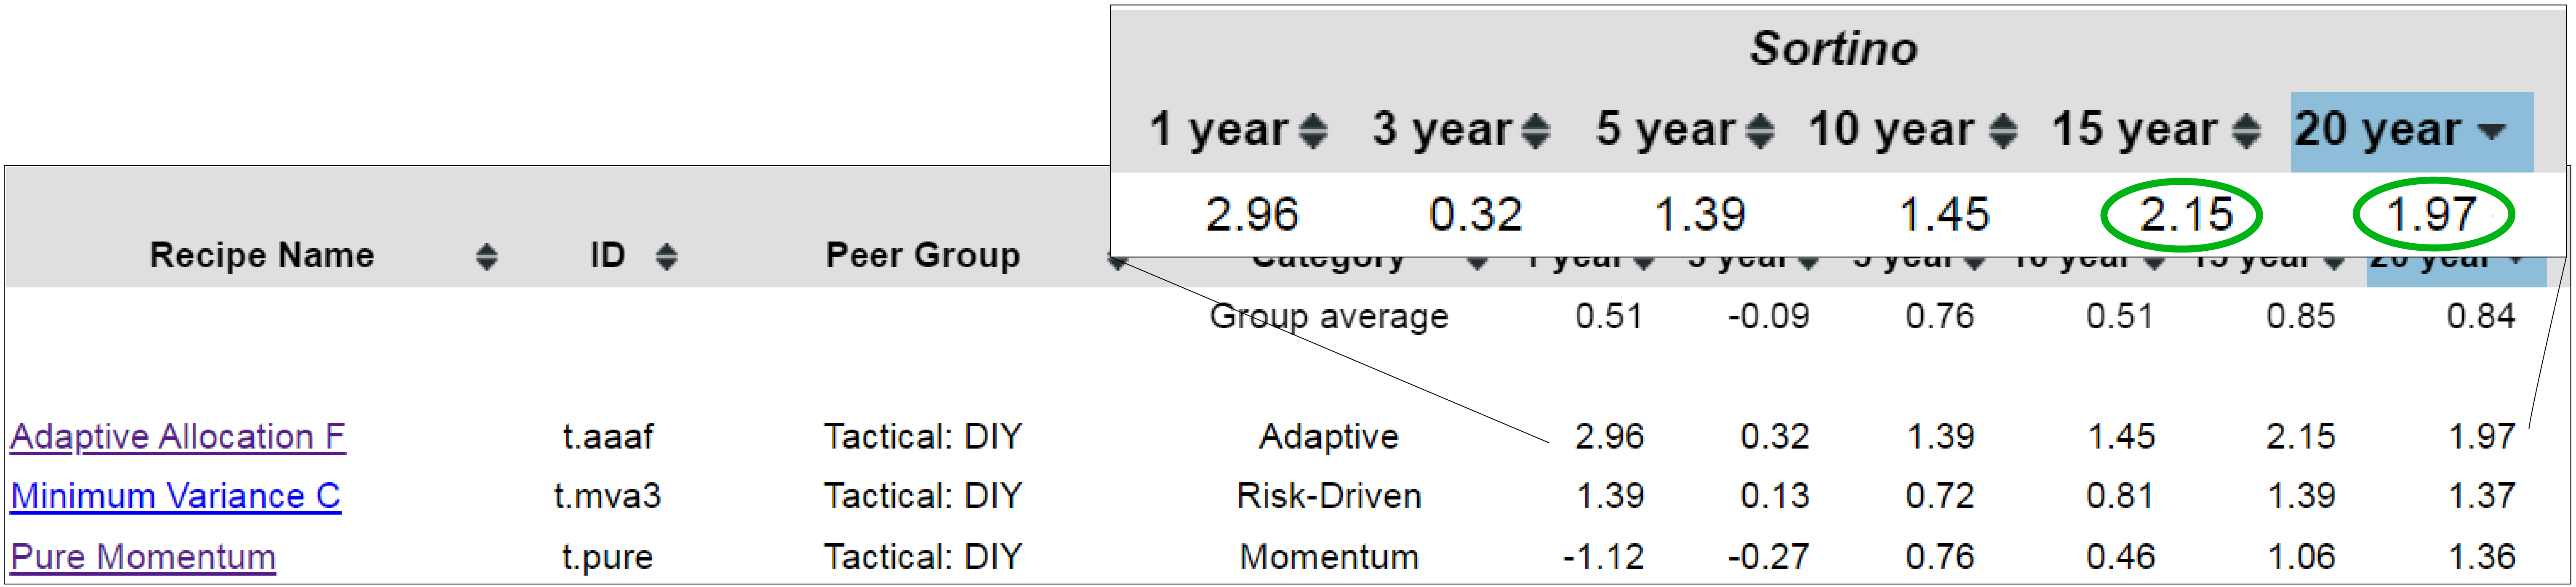
- Adaptive Asset Allocation F (t.aaaf) stands out with Sortino ratios of 2.15 over 15 years and 1.97 over 20 years, indicating strong risk-adjusted performance.
- Numerous portfolios also exceed a 1.0 Sortino ratio, a positive sign for those balancing returns with downside risks.
Mutual Funds with High Sortino Ratios
When filtering only for mutual funds above a 1.0 Sortino ratio:
- Hundredfold Select Fund (SFHYX) and Janus Henderson Balanced Fund (JANBX) consistently surpasses the 1.0 benchmark over 20 years.
- Berkshire Hathaway (BRK.A), while technically a stock, is included for comparison due to its investment-company profile.
Most portfolios above 1.0 are tactical recipes. However, at least one strategic recipe also reaches a 1.21 Sortino ratio which is the Permanent Plus (s.plus), demonstrating strong long-term efficiency despite a static allocation.
Vanguard Funds and their Sortino Ratio
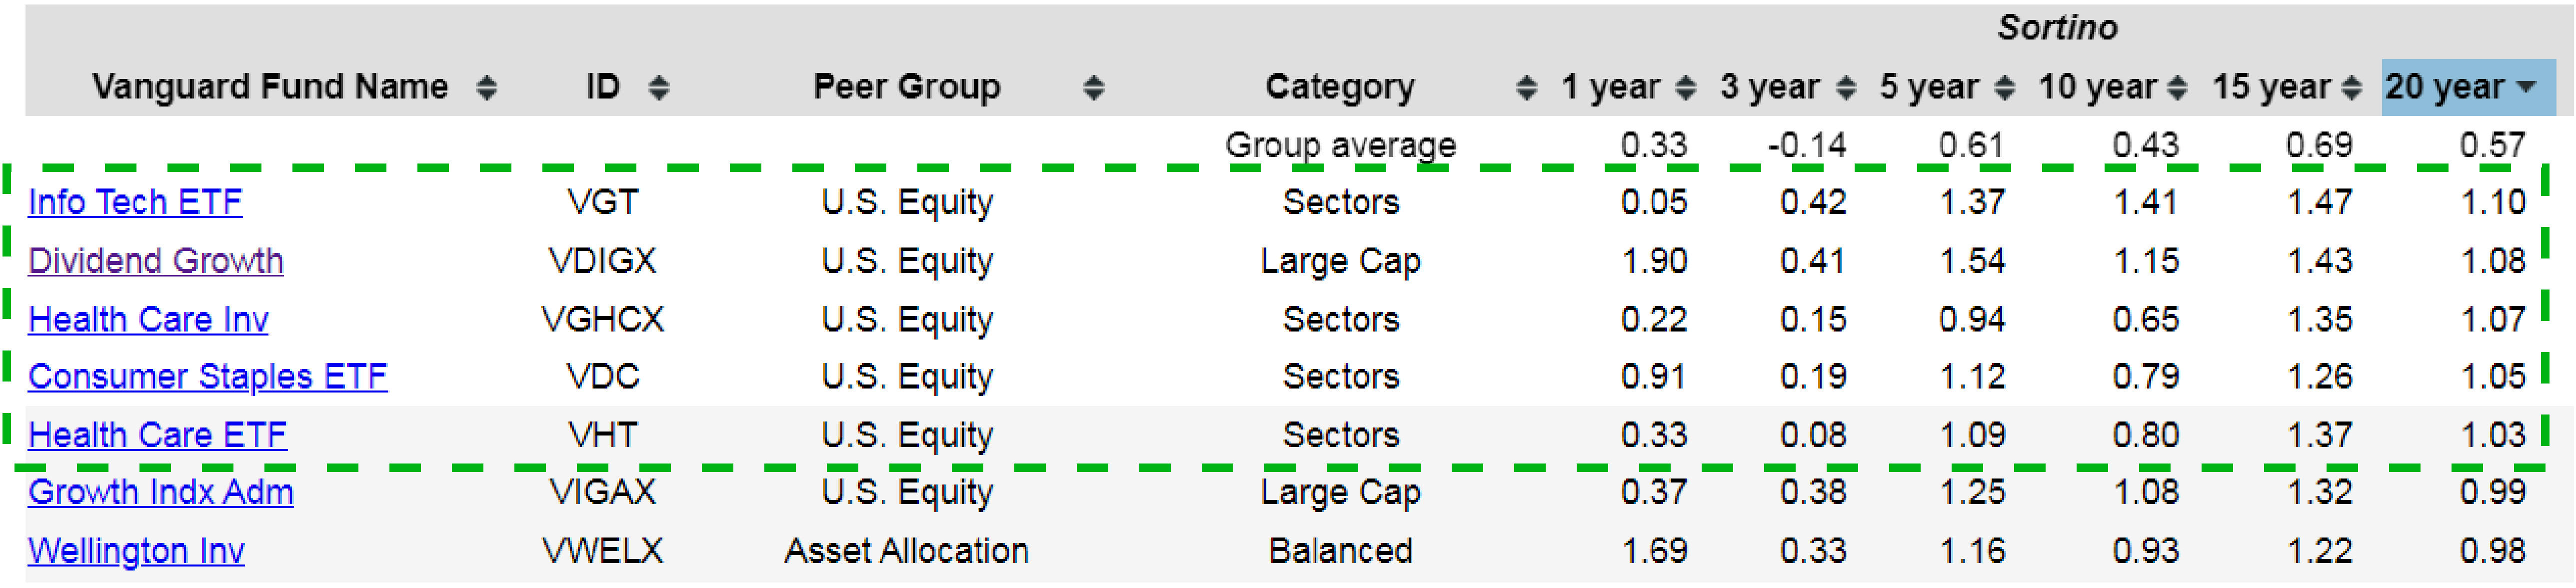
A parallel analysis through Fund Insights (Recipe Investing’s sister platform) focuses on major fund families (Vanguard, Fidelity, iShares, American Funds). Examining Vanguard’s 20-year track records reveals only five funds surpassing a 1.0 Sortino ratio, illustrating the metric’s selectiveness in identifying consistent, risk-adjusted performers. All showed robust returns coupled with lower downside risk relative to their peers.
Top Vanguard performers include:
- Consumer Staples ETF (VDC)
- Health Care Fund (VGHCX)
- Dividend Growth Fund (VDIGX)
- Information Technology ETF (VGT)
Comparing Sortino Ratios Across Sample Portfolios
Certain sample portfolios underscore the Sortino ratio’s utility:
- iShares 1–3 Year Treasury Bond ETF (SHY): Near risk-free investment with a very low ratio of 0.09
- Adaptive Asset Allocation F (t.aaaf): Approaching a 2.0 ratio, indicating a strong mix of returns and low downside volatility
- Nasdaq-100 (QQQ): High annualized return of 14.8%, but a lower Sortino compared to t.aaaf’s 1.96
Similarly, the S&P 500 (SPY) and a 60/40 Balanced (s.6040) portfolio have nearly identical Sortino ratios, illustrating how total return and risk can offset one another when measured this way. A ratio near or above 1.0 generally signifies a balanced relationship between return and downside risk.
Recent Standouts in One-Month Returns
Several portfolios also posted strong short-term gains:
- Berkshire Hathaway (BRK.A): +3% last month
- Black Swan Hyperinflation (s.swan), Safe Haven (s.have), Anti Beta Fund (BTAL), SPDR S&P International Dividend ETF (DWX)
Each strategy performed well, aligning with its core objective—be it volatility hedging or a defensive, lower-beta approach.
The Trade-Offs of Sector Rotation
A few portfolios showed steep declines over the month, largely due to sector rotation strategies. Timing is a significant factor: if a sector slips mid-month, a monthly rebalancing schedule won’t adjust immediately. Although weekly or daily rebalancing could address this sooner, such options increase transaction costs and complexity.
This monthly interval finds a middle ground, minimizing costs while retaining most long-term benefits. Even with occasional rough patches, a sector rotation approach such as the Quartile Sector Rotation (t.srqr) has managed an impressive 22% annualized return over 15 years, indicating its potential despite short-term volatility.
These rotation strategies generally wait until month-end to incorporate negative performance data. The algorithm then determines whether to exit struggling sectors in favor of stronger ones. This lag is an inherent compromise of a monthly schedule—offering a balance between cost-effectiveness and responsiveness.