2025 Sector Rotation, Adaptive Allocation, New Subs & Passive vs Active
Sector Rotation, Adaptive Allocation, New Analytics, and Passive vs. Active Trade-offs (Feb 2025)
Topics this month
- Sector Rotation Funds Performance: Top-performing sector rotation funds
- Adaptive Allocation & Low-Equity Success: Performance insights from Adaptive Allocation F and Black Swan Hyperinflation Portfolio Recipes
- New Subscription Preview: Advanced Analytics for Vanguard, iShares, Fidelity, and American Funds
- Passive vs. Active Trade-offs: Comparing the simplicity of ETFs with the potential of actively managed Portfolio Recipes
Welcome to the February 2025 commentary from RecipeInvesting.com. Our platform tracks more than 200 investable portfolio recipes, covering both strategic and tactical approaches. These portfolios help investors build well-balanced strategies that manage risk and optimize returns. Each month, we rebalance all portfolio recipes and update their risk and return metrics to maintain accuracy and relevance.
For the investor-level subscription, this provides access to a comprehensive analysis platform, enabling detailed exploration and potential discoveries. Within this section, investors can navigate to the full list of portfolio recipes that are actively tracked. Each recipe is labeled with a "t-dot" suffix to indicate a tactical approach, meaning the allocation is adjusted monthly by an algorithm. Conversely, a "s-dot" suffix denotes a static allocation, which remains unchanged over time. The listed tickers represent exchange-traded funds (ETFs) or mutual funds that align with asset allocation strategies of interest. These funds are particularly relevant for comparative analysis, as they offer insights into both tactical and static (or strategic) portfolio approaches that are monitored. This framework allows investors to evaluate and contrast different allocation methodologies effectively.
Top-performing sector rotation funds
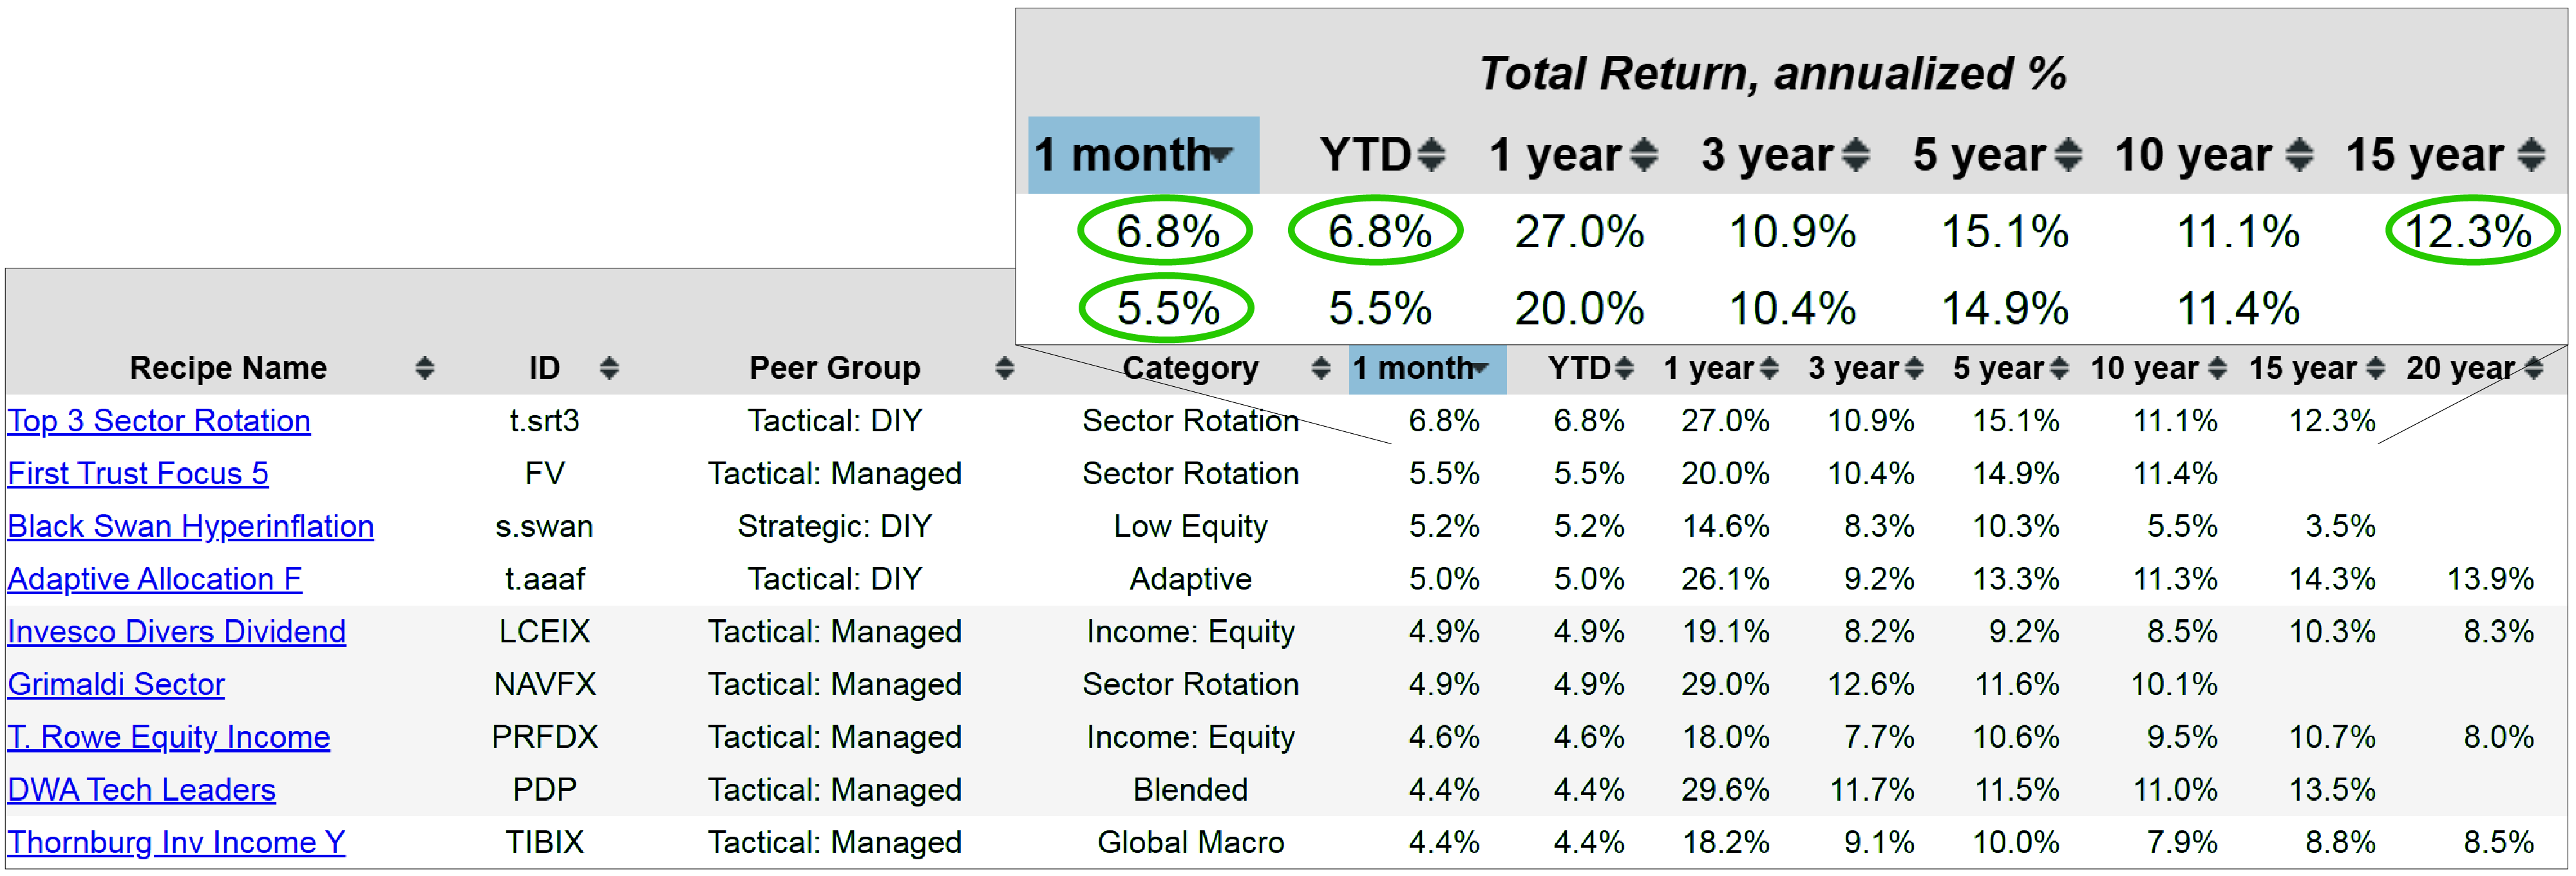
Investors can analyze performance on a monthly basis to identify top-performing funds. This month, sector rotation funds have shown notable results. Among these, the First Trust Focus 5 (FV), an exchange-traded fund, has delivered strong performance over the past month, ending January 31, 2025. However, the standout performer is the Top 3 Sector Rotation (t.srt3), which evaluates various sectors, selects the top three, and allocates investments accordingly. This fund achieved a 6.8% return for the month. Since the analysis covers only the first month of the calendar year, the year-to-date performance remains the same. Notably, over the past 15 years, this strategy has demonstrated consistent success, delivering an annualized return of 12.3%.
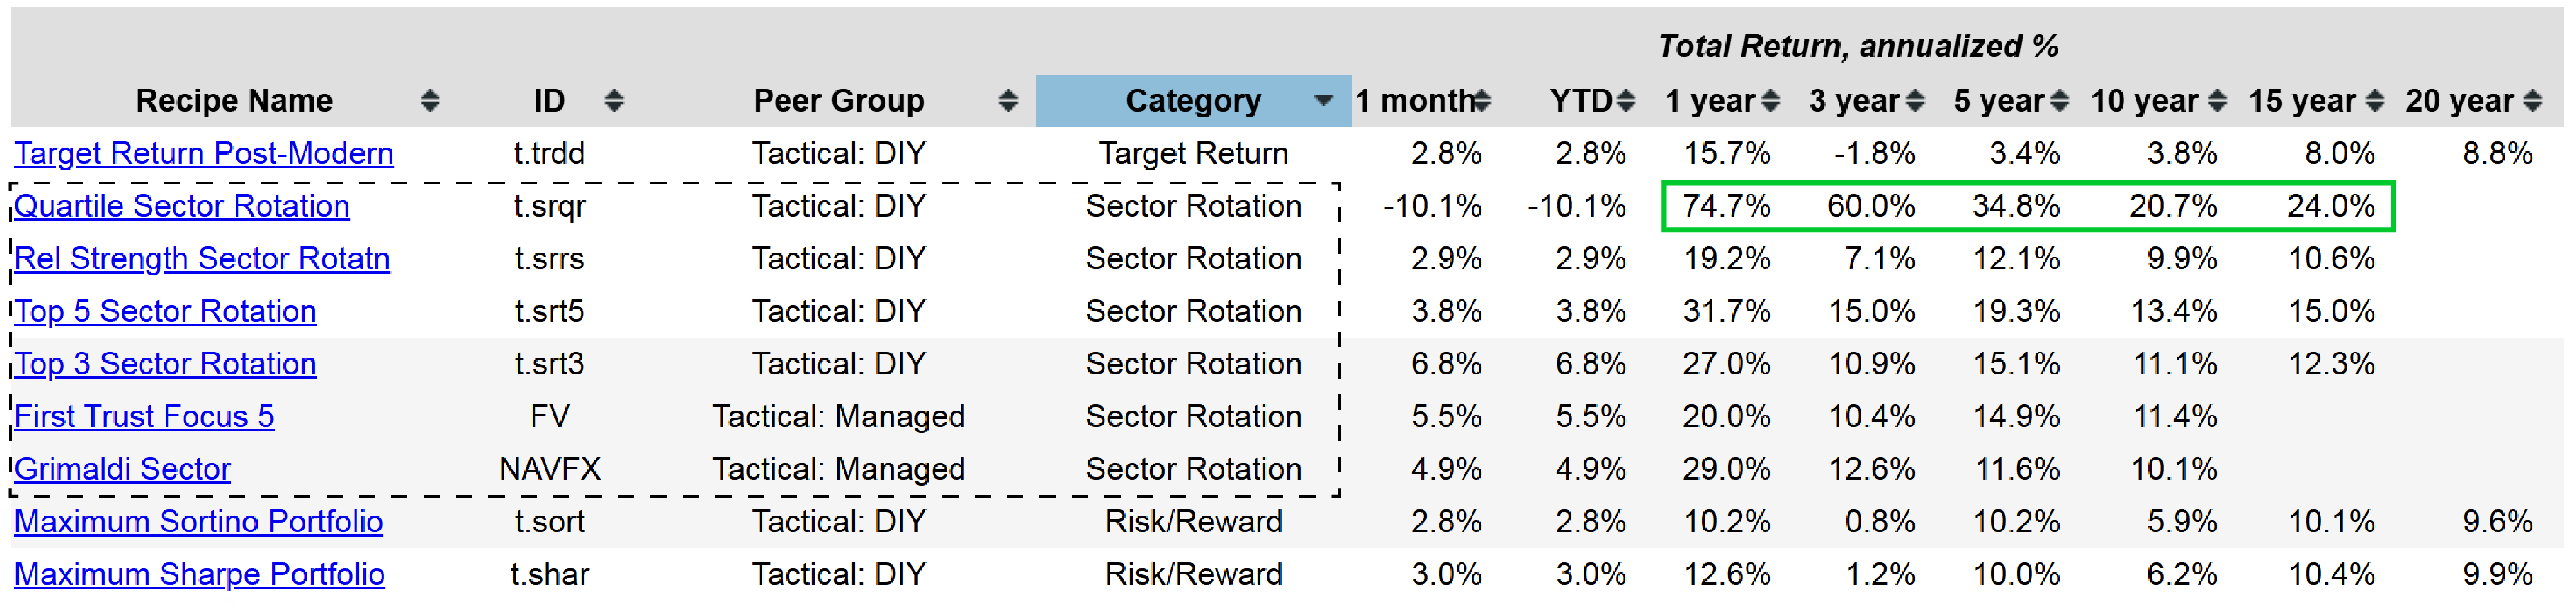
Further down the list, another sector rotation fund, the Grimaldi Sector (NAVFX) mutual fund, demonstrates solid performance. This analysis also allows investors to sort funds by category, grouping all sector rotation funds together for easier comparison. Among these, the Quartile Sector Rotation (t.srqr) stands out, delivering impressive returns over the past 15 years. However, it experienced a slight drawdown in the most recent month, likely due to its concentrated exposure to a specific sector. This highlights the high-risk, high-return nature of such tactical portfolio strategies. When examining these sector rotation funds collectively, excluding the Quartile Sector Rotation as an outlier, the top performers have consistently achieved returns ranging from 11% to as high as 19%. Notably, even the top three funds have exhibited similar performance trends over the 15-year historical period, underscoring their reliability and strong track record. This consolidated view provides valuable insights into the consistent success of sector rotation strategies.
Performance insights from Adaptive Allocation F and Black Swan Hyperinflation funds
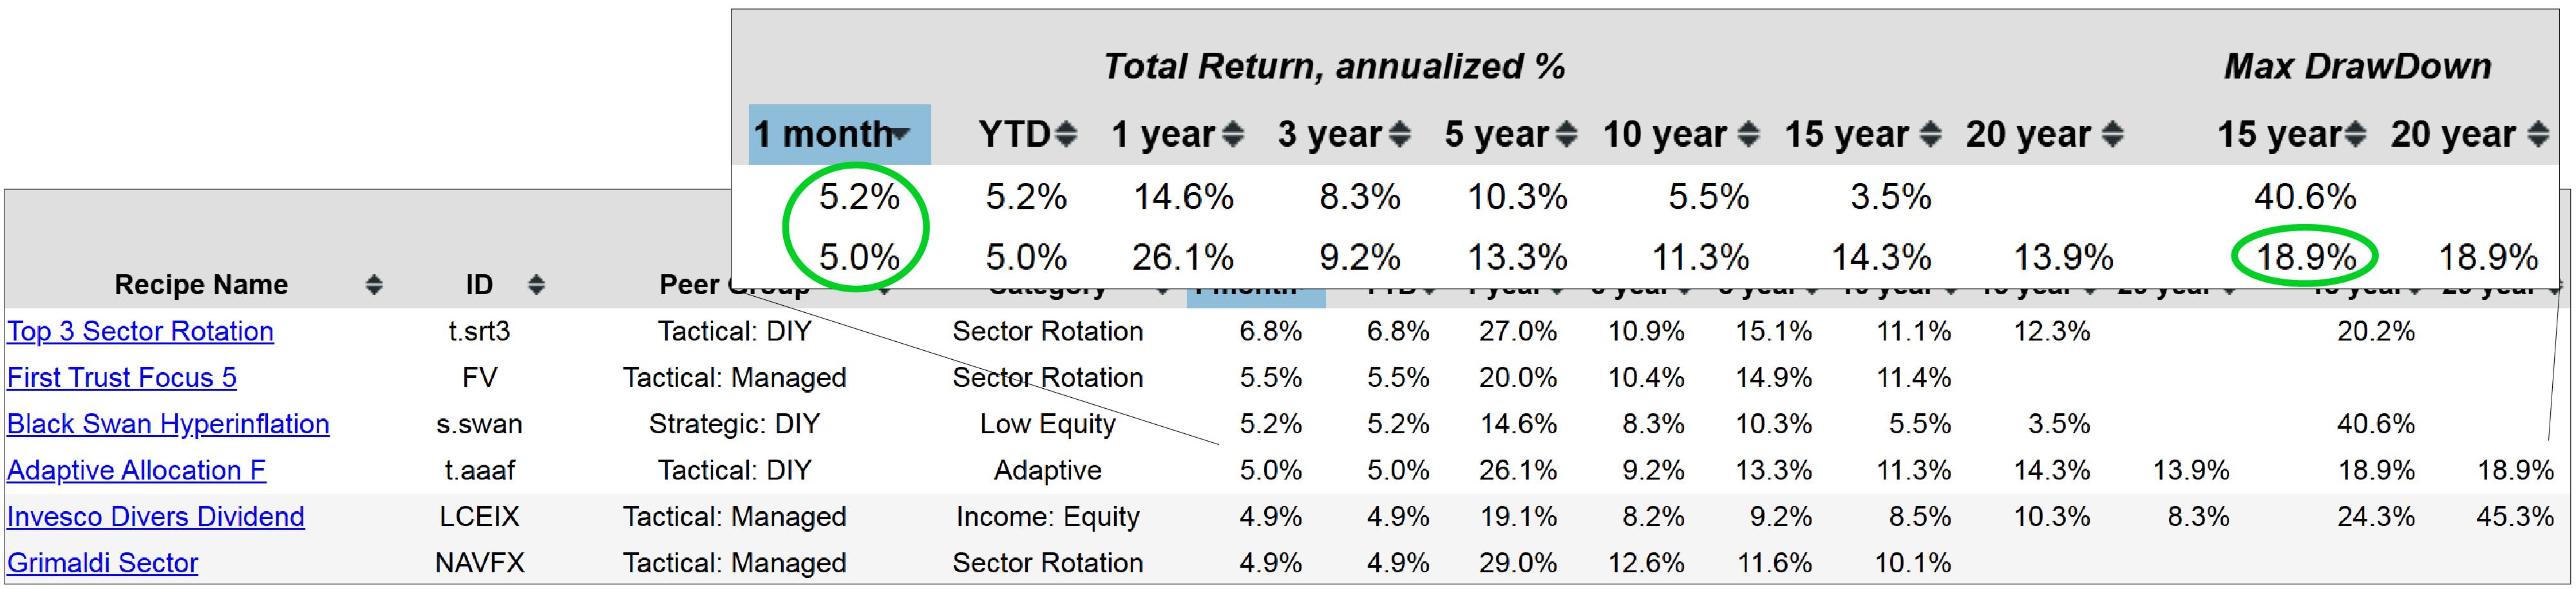
This provides an overview of some of the sector rotation funds. Reviewing the one-month performance, one can observe the low equity fund Black Swan Hyperinflation (s.swan), which has performed well during that period. In addition, the Adaptive Allocation F (t.aaaf), an adaptive asset allocation fund, has also shown strong performance over the past month. This particular allocation has gained popularity among investors due to its consistent performance—delivering nearly 14% annualized returns over the past 20 years and over 14% during the past 15 years, even when accounting for the 2008 drawdown. Notably, the maximum decline for this portfolio was just under 19%, which compares favorably to other benchmarks. For example, the S&P 500 Equal Weight (RSP) declined by 55% over the same 20-year period, while the t.aaaf experienced a decline of only 18.9%.
When examining the monthly performance, the top performers stand in contrast to those that struggled. For instance, the Quartile Sector Rotation, which has historically delivered strong results, experienced a challenging month in January. This strategy operates on a dynamic algorithm designed to adapt to changing market conditions. It selects a new fund from a universe of approximately 120 funds if the currently invested fund falls below the 25th percentile in momentum rankings. In such cases, the algorithm shifts to a top-performing fund within the top quartile. Despite the recent downturn, the Quartile Sector Rotation has not yet triggered a fund change, as the current holding remains within the desired performance threshold. This adaptive approach underscores the strategy’s ability to navigate market fluctuations while maintaining a focus on momentum-driven opportunities.
New Subscription Product Preview
There would be an upcoming product, giving investors an exclusive first look. This new subscription product is initially focused on Vanguard funds, with plans to later include iShares ETFs, Fidelity funds, and American funds. The idea behind this offering is to apply the same risk-return scatterplot analysis used for portfolio recipes to all Vanguard funds. By Vanguard funds, it refers primarily to the investor and Admiral share classes. While some institutional share classes are not included, they typically have a corresponding investor or Admiral share option. The scatterplots demonstrate the expected risk versus return relationship, revealing a distinct frontier—an optimal balance—situated in the upper left portion of the chart. The upper left corner signifies that funds beyond this point would be unrealistically favorable. The frontier becomes apparent when analyzing every Vanguard fund for which we have 20 years of data.
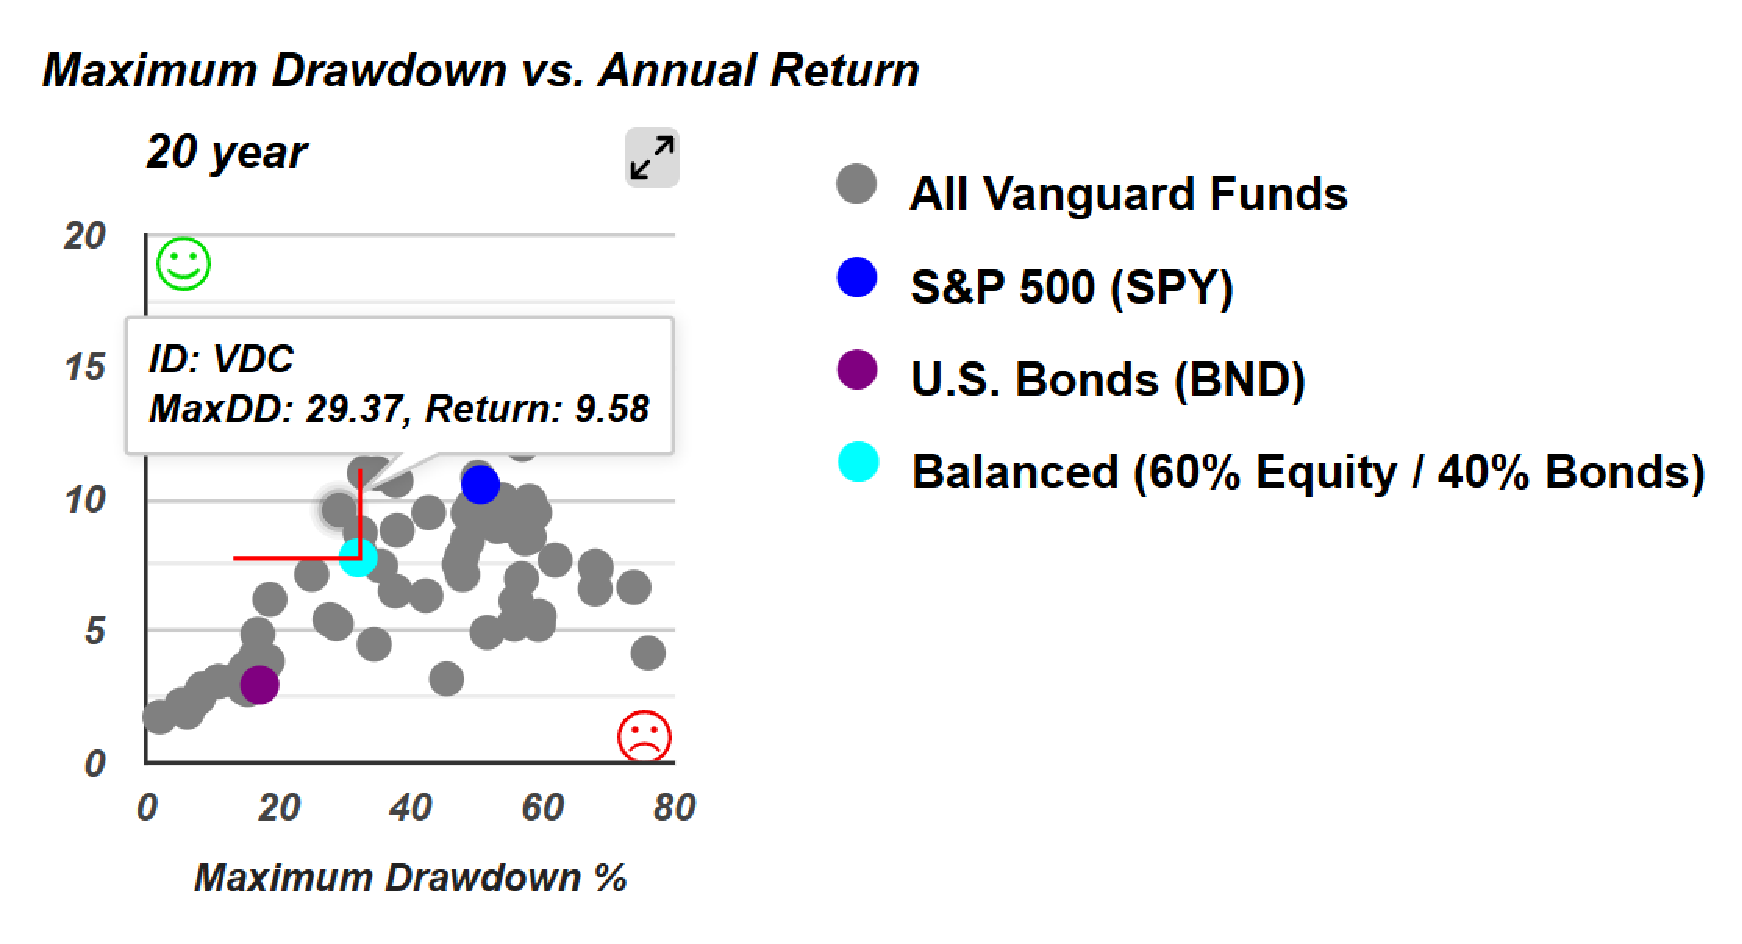
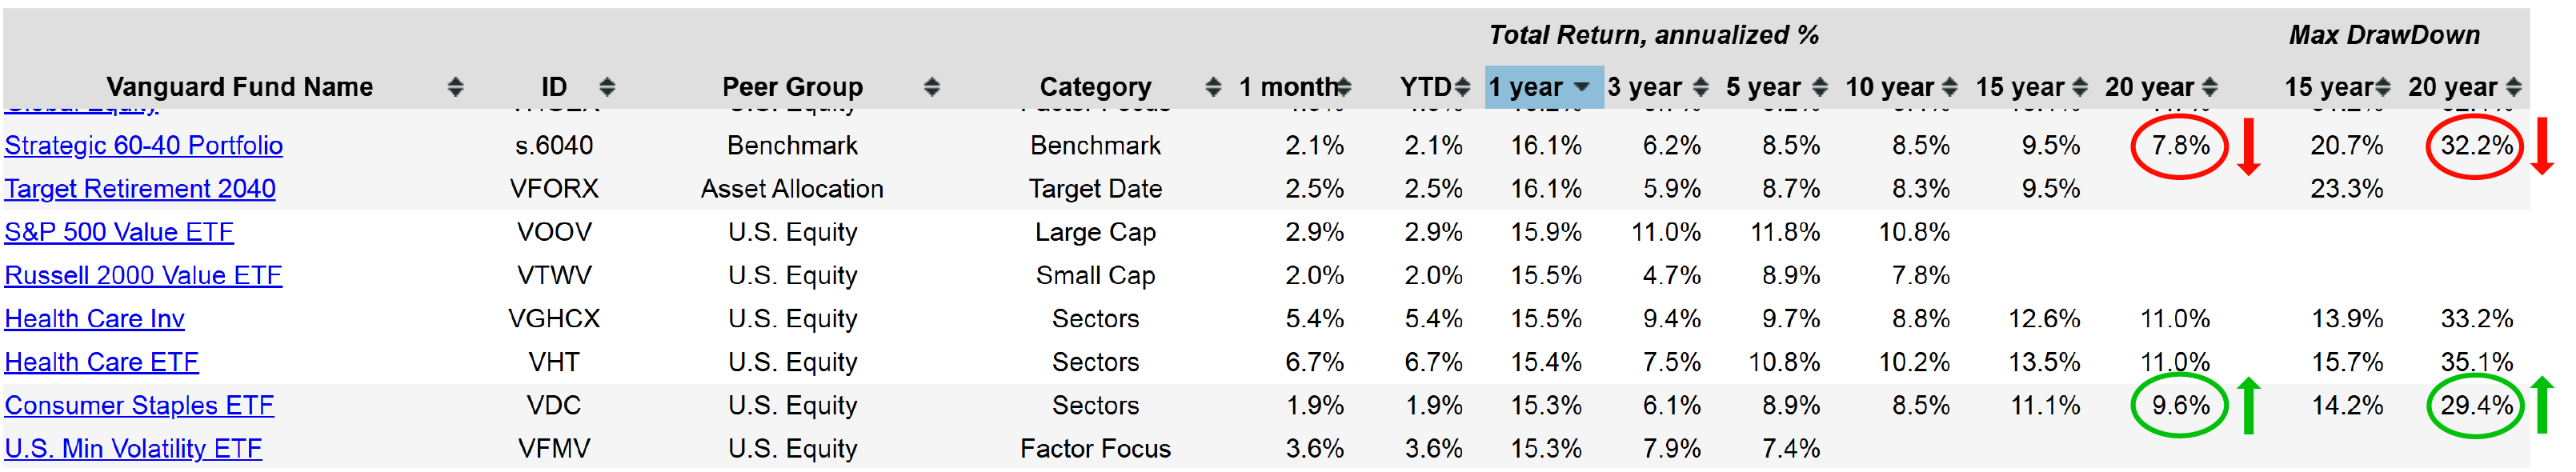
Several insights emerge from this analysis. For example, the 60/40 Balanced (s.6040) fund serves as a benchmark in the 20-year scatterplot, represented by a teal dot in the crosshair. Notably, a few funds have outperformed this benchmark. One such example is VDC—a Consumer Staples Exchange Traded Fund—which, over the 20-year period, has achieved higher returns and lower risk compared to the 60/40 benchmark. Specifically, the 60/40 Balanced fund experienced a drawdown of 32.2% over the past 20 years, likely during the 2008 financial crisis, while VDC's maximum drawdown was 29.4% based on month-end returns. Furthermore, over the same period, Consumer Staples delivered a 9.6% return, whereas the balanced 60/40 fund posted a 7.8% return. This comparison provides an interesting perspective on the performance of these funds over various time frames.
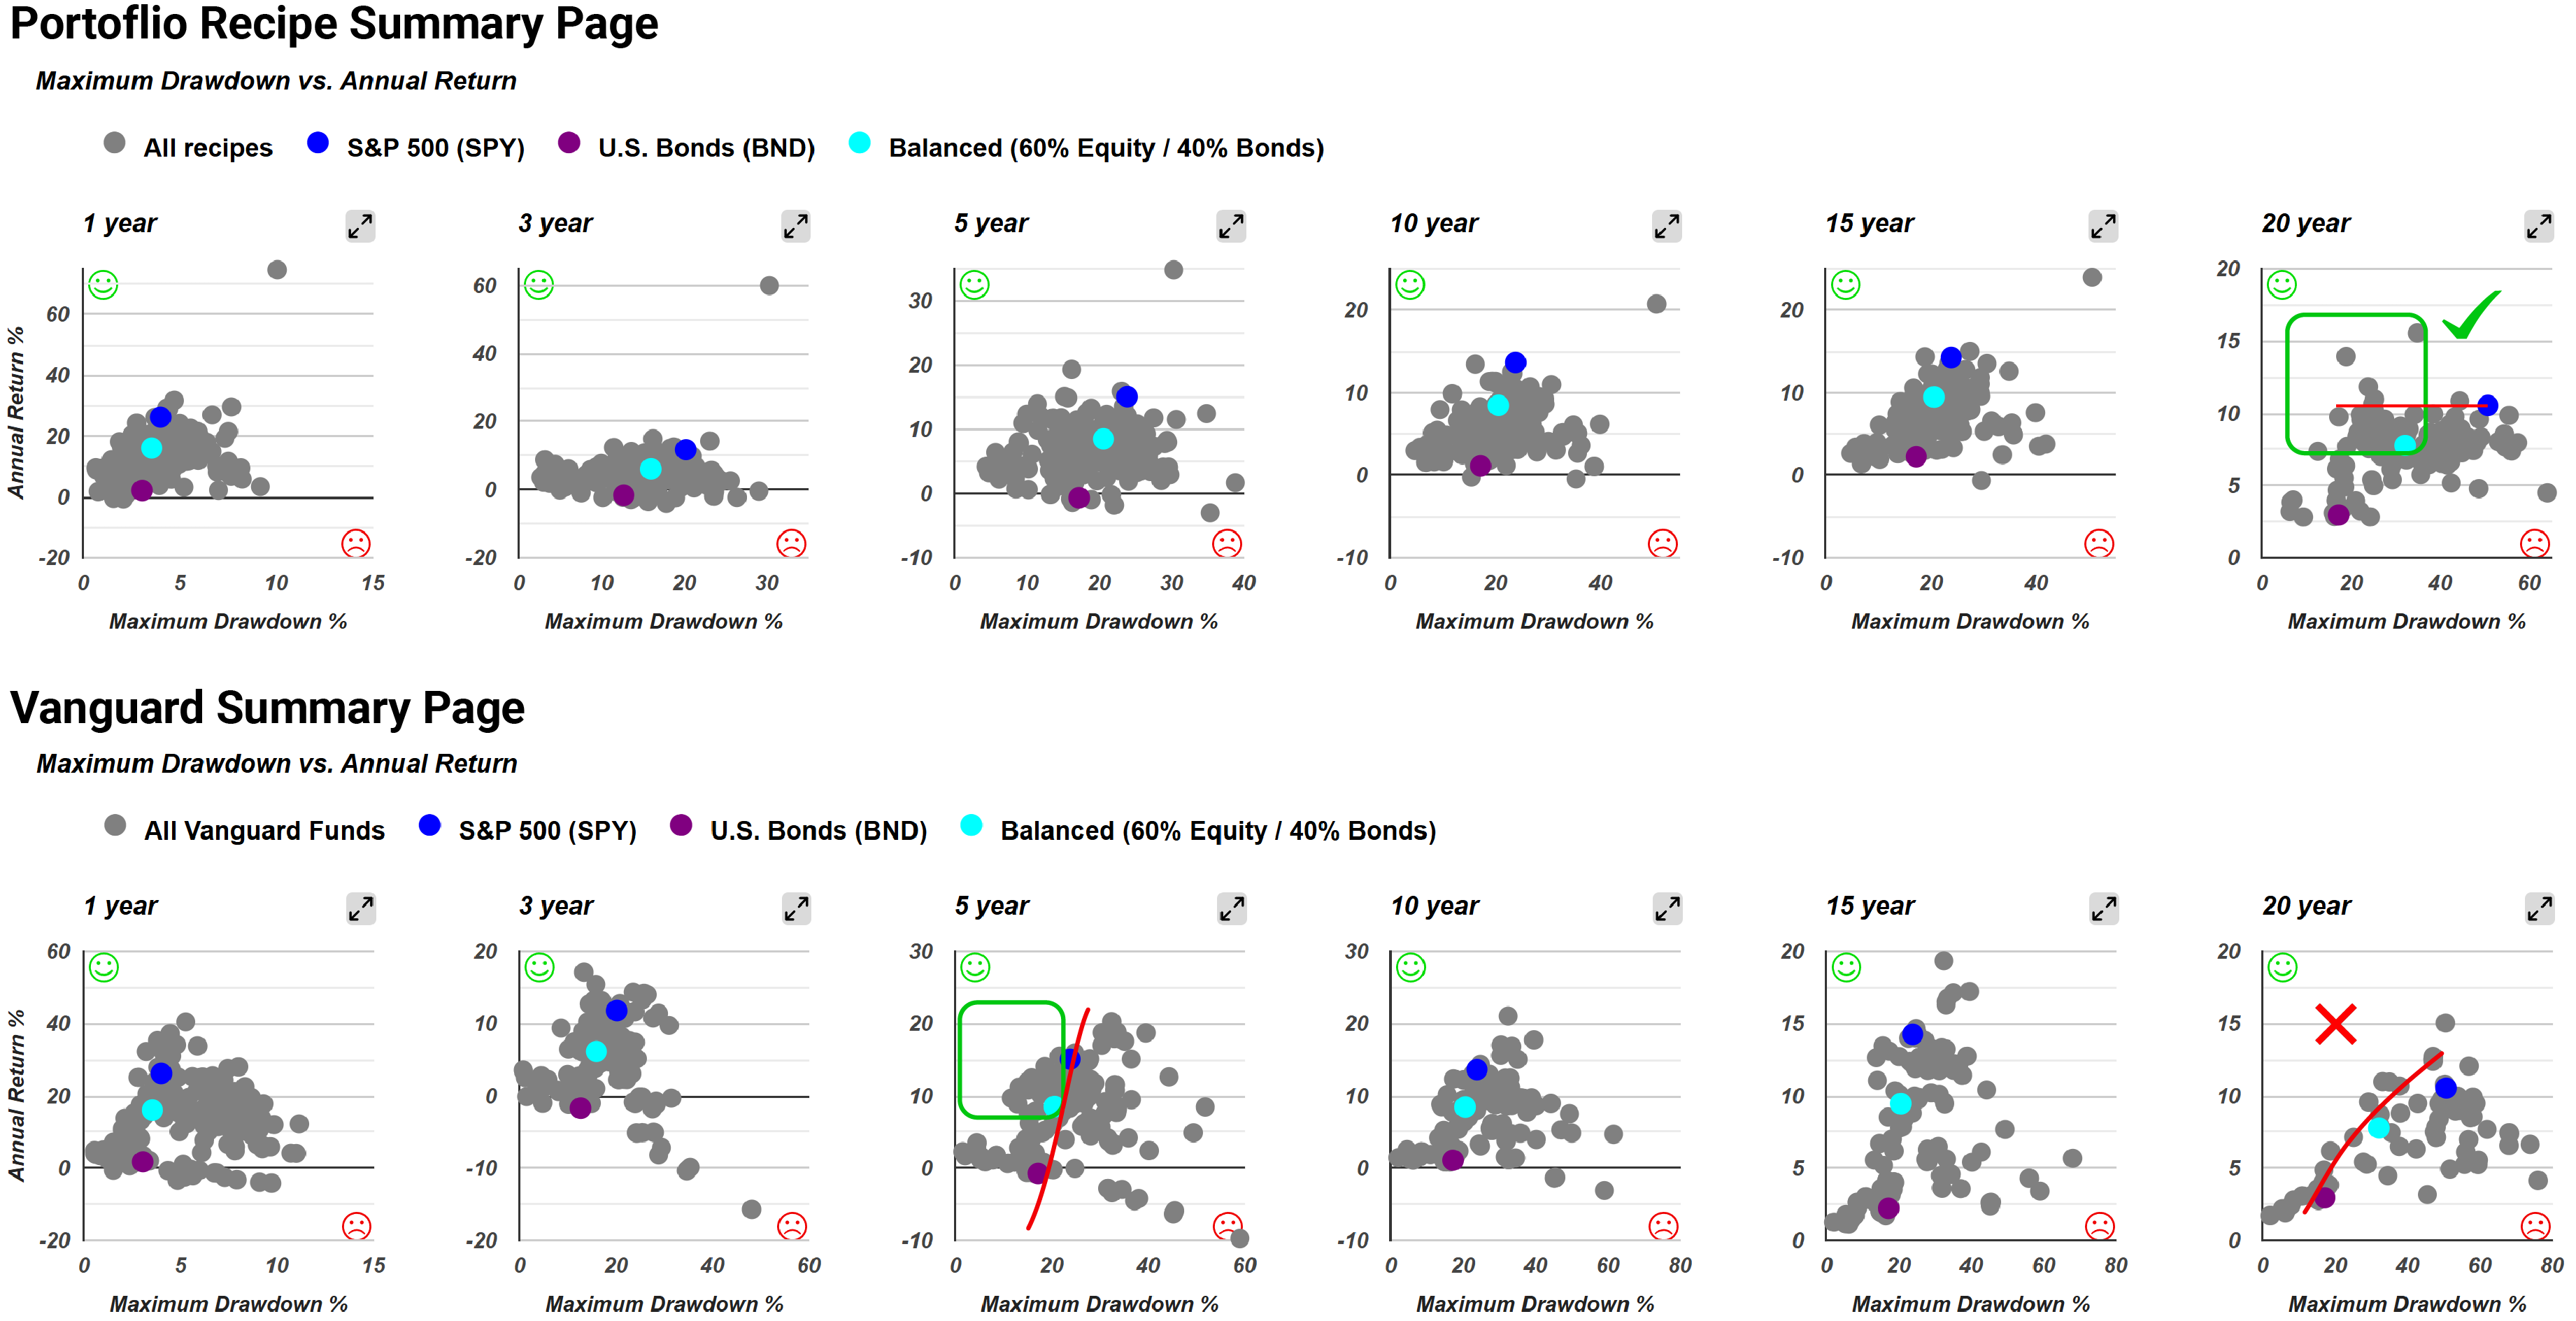
Over a 5-year period, the performance frontier, represented by the three benchmarks—the S&P 500 (SPY), a bond fund (BND), and the 60/40 balanced fund (60% equities, 40% fixed income)—aligns with expectations. In this period, there are more options positioned above and to the left of the benchmark. However, as the time period extends, the positions tend to converge, forming a more predictable frontier with few opportunities in the upper-left quadrant. This contrasts significantly with the 20-year period on RecipeInvesting’s scatterplot, where numerous opportunities appear above and to the left of both the 60/40 benchmark and the S&P 500. In fact, there are at least five portfolio recipes that have delivered higher returns with lower risk compared to both the S&P 500 and the 60/40 benchmark. Over a 5-year period, investors can observe a frontier formed by our three benchmarks: the S&P 500, a bond fund, and the 60/40 balanced portfolio (60% equities, 40% fixed income). During this period, there is a notable concentration of data points above and to the left of the benchmark, indicating superior performance in terms of higher returns and lower risk. However, as the timeframe extends, the data increasingly align along a well-defined frontier, with few observations exceeding it. In contrast, the 20-year scatterplot from RecipeInvesting reveals several opportunities that outperform not only the 60/40 benchmark but also the S&P 500 benchmark. In fact, at least five different portfolio recipes demonstrate both higher returns and lower risk compared to these benchmarks.
Not only do these insights apply to Vanguard funds, but the same approach is being extended to other fund families as well. For example, consider iShares ETFs, which are now evaluated using the same analytics applied to RecipeInvesting portfolio recipes. Among these, the Bitcoin Trust ETF (IBIT) has performed phenomenally well over the past year and month, although gold and silver miners have outpaced it. It is important to note that not all iShares ETFs have a 20-year track record; however, for those that do, the top performers are in sectors such as U.S. technology, semiconductors, and expanded technology. Nonetheless, the 20-year drawdowns for these ETFs generally fall in the high 40% to low 50% range, sometimes even reaching the high 50% range. This clearly demonstrates that obtaining superior returns from an iShares ETF typically comes with a significant level of risk.
Passive vs. Active Trade-offs
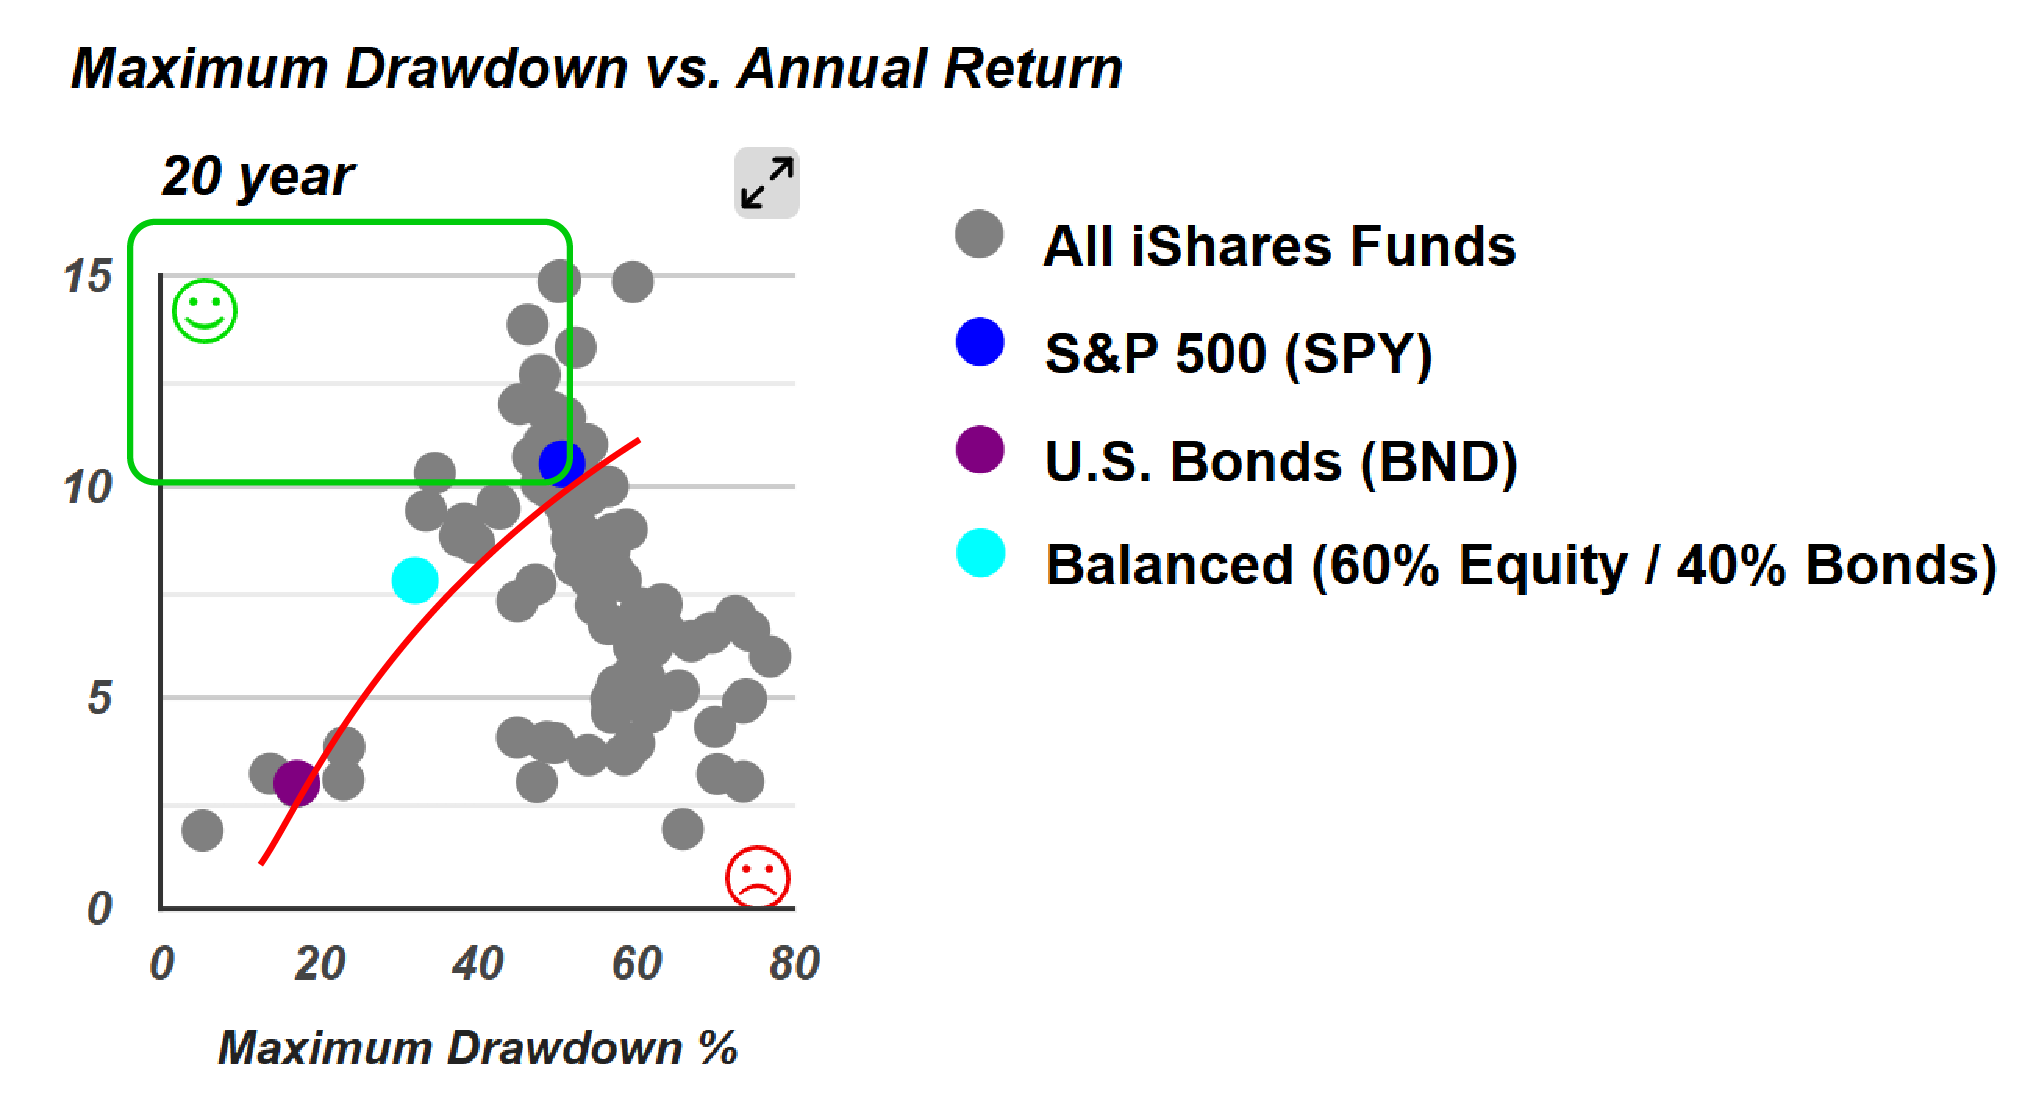
In the 20-year chart, an interesting observation emerges when drawing a line from fixed income through balanced portfolios to the S&P 500. Several funds fall within this region, outperforming both the S&P 500 and the balanced benchmark. For example, the iShares U.S. Healthcare ETF (IYH), iShares Biotechnology ETF (IBB), and iShares U.S. Consumer Staples ETF (IYK) demonstrates superior performance relative to these benchmarks. This indicates that some individual iShares ETFs can indeed outperform standard benchmarks. However, it also highlights the limitations of passive investing, as there are relatively few opportunities for achieving both lower risk and higher return beyond the benchmarks. In contrast, the recipe summary page offers a wide array—well over a dozen—of alternative options for investors seeking more diverse strategies.
This highlights the trade-off between passive and actively managed investments. Passive funds, such as exchange-traded funds (ETFs), offer great pricing and are simple to implement with a single trade or ticker. However, there are clear opportunities within more actively managed mutual funds and portfolio recipes that can deliver significantly better returns, often with lower risk or comparable risk to some exchange-traded funds. That illustrates the trade-off: passive funds and exchange-traded funds offer excellent pricing and can be implemented very simply with a single trade. However, there are opportunities within more actively managed mutual funds and portfolio recipes that provide significantly higher returns while maintaining low or comparable risk to those ETFs.
This concludes this week's overview. Stay tuned for further updates on new products related to Vanguard, Fidelity, iShares, and American Funds. Investors interested in receiving timely release information can contact us via email or through our contact form.