4 Sector Rotation Portfolios: 3 Winning Ideas And 1 You Must Avoid
4 Sector Rotation Portfolios: 3 Winning Ideas And 1 You Must Avoid
- We found one approach to sector rotation with a 16.7% annual return over the past 10 years. This is twice the return of the S&P 500 with similar risk.
- Two other sector rotation approaches (i.e., recipes) beat a Balanced Portfolio benchmark, and a fourth was an under-performer.
- These sector rotation recipes are based on approaches from well-known investors and authors.
- Each sector rotation recipe invests in ETFs or mutual funds and rebalances monthly.
- For each portfolio recipe, we analyzed the past 10 years to obtain a detailed risk and return profile.
The appeal of sector rotation for investors is clear: since the business cycle causes some industry sectors to do well while others suffer, you want to be out of the down-trending sectors and invested in the up-trending sectors. A sector rotation model (or "recipe" for short) attempts to produce a market-beating portfolio by telling you which sectors to buy and which to avoid.
The Challenge
However, it's difficult to spot the phases of the business cycle in a timely manner. Charles Schwab & Co. (SCHW) adds this warning to a diagram of the business cycle:
"This is a hypothetical illustration of a typical business cycle; not all cycles follow the same pattern or progress in the same sequence. Often, phases can be identified only in retrospect."
- (Onward Magazine, Summer 2016, p.6)
In other words, it's tough to pick the right sectors at the right time.
The Question
So is there a sector rotation recipe that provides a decent return without too much risk?
Our Approach
To answer this question, we followed these steps:
- Step 1. Find Sector Rotation recipes. We searched articles, blogs, whitepapers, and newsletters. We found four that we wanted to compare. These are algorithmic recipes that use exchange-traded funds (ETFs) or mutual funds to invest in the sectors.
- Step 2. Create the Sector Rotation portfolios based on the recipes. We used the step-by-step investment approach suggested by each recipe. Depending on the specific recipe, the portfolio ingredients include Fidelity funds, Rydex funds, SPDR ETFs, iShares ETFs, and a few other sector funds.
- Step 3. Run the analysis. We calculated historical performance for each recipe using monthly total returns through May 2016. We calculated return and risk for the past 1, 3, 5, 7, and 10 years.
- Step 4. Interpret the results and identify winners. We plotted risk vs. return for the recipes and identified the best performers. We also compared these 4 recipes to 130 other portfolio recipes tracked by VizMetrics at Recipe Investing.
Step 1: Find Sector Rotation recipes
After our research, we chose the following four sector rotation recipes:
- Quartile Sector Rotation. This recipe was inspired by an upgrading approach which has been used since the 1990's by newsletter publishers NoLoad FundX and Sound Mind Investing. To see the risk and return analysis for Quartile Sector Rotation, visit the recipe detail page.
- Relative Strength Sector Rotation. This is based on a model described by Meb Faber in his December 4, 2013 article "Building a Simple Sector Rotation on Momentum and Trend." To see the risk and return analysis for Relative Strength Sector Rotation, visit the recipe detail page.
- Top 5 Sector Rotation. This recipe uses an algorithm described by Jay Kaeppel in his January 6, 2014 article "Jay's Simple Momentum Sector Fund System." To see the risk and return analysis for Top 5 Sector Rotation, visit the recipe detail page.
- Top 3 Sector Rotation. This is based on Meb Faber's "Top 3 Hedged" approach from his June 25, 2009 article "Combining Rotation and Timing Systems." To see the risk and return analysis for Top 3 Sector Rotation, visit the recipe detail page.
For comparison benchmarks, we chose S&P 500 Equities (NYSEARCA:SPY), and a 60/40 Balanced portfolio consisting of 60% Stocks (NYSEARCA:VTI) and 40% Bonds (NASDAQ:BND).
Step 2: Create the Sector Rotation portfolios based on the recipes
Next we defined the exact algorithm for each recipe using the parameters shown in Exhibit A (below). For each recipe, we defined the following attributes and rules to create an investable portfolio.
- Asset universe: What types of assets does the recipe use?
- Number of assets to hold: How many assets are held at any one time?
- Asset buy signal: When do I buy particular assets?
- Asset sell signal: When do I sell particular assets?
- Rebalance frequency: How often do I buy and sell to adjust the portfolio holdings?
- Cash hedge provision: Does the recipe have a mechanism to invest in cash?
Exhibit A: Four Sector Rotation recipes
| Quartile Sector Rotation | Relative Strength Sector Rotation | Top 5 Sector Rotation | Top 3 Sector Rotation | |
| VizMetrics ID | t.srqr | t.srrs | t.srt5 | t.srt3 |
| Asset universe | 117 sector ETFs and no-load mutual funds: 11 SPDR ETFs, 38 Fidelity Select Sector mutual funds, 17 ProShares UltraSector mutual funds, 12 Vanguard ETFs, 5 T. Rowe Price mutual funds, 13 iShares ETFs, 2 Janus mutual funds, 17 Rydex mutual funds, 2 Hennessey mutual funds | 9 U.S. SPDR sector ETFs (XLY, XLP, XLE, XLFS, XLF, XLV, XLI, XLB, XLRE, XLK, XLU) | 38 Fidelity Select Sector Funds | 38 Fidelity Select Sector Funds |
| Number of assets to hold | One | Up to Nine | Up to Five | Up to Three |
| Asset buy signal | Buy top ranked 1 asset based on 1+3+6+12 month returns | Buy each asset whose 10-month total return is above its 10-month simple moving average total return. | Buy top ranked 5 assets based on 12-month return | Buy top ranked 3 assets based on 3+6+12 month returns |
| Asset sell signal | Sell when asset falls out of top quartile | Sell when asset's 10-month total return falls below its 10-month simple moving average total return | Sell when asset falls out of Top 5 | Sell when asset falls out of Top 3 |
| Rebalance frequency | Monthly, as needed | Monthly, as needed | Monthly, as needed | Monthly, as needed |
| Cash hedge provision | None | Yes; if fewer than 4 sectors are above their 10-month simple moving averages, then invest in cash as follows: if 3 above = 25% cash; 2 above = 50% cash; 1 above = 75% cash; 0 above = 100% cash | Yes; if a top 5 asset has a negative 12-month return, then hold cash instead of that asset | Yes; if SPY is below its 10-month simple moving average, then move portfolio to 100% cash |
Step 3: Run the Analysis
To measure performance, we tested each portfolio recipe to find the total return over 1-, 3-, 5-, 7-, and 10-year periods. As a risk measure, we used 10-year maximum drawdown, which is the largest decline in the portfolio's value over the past 10 years from June 2006 through May 2016.
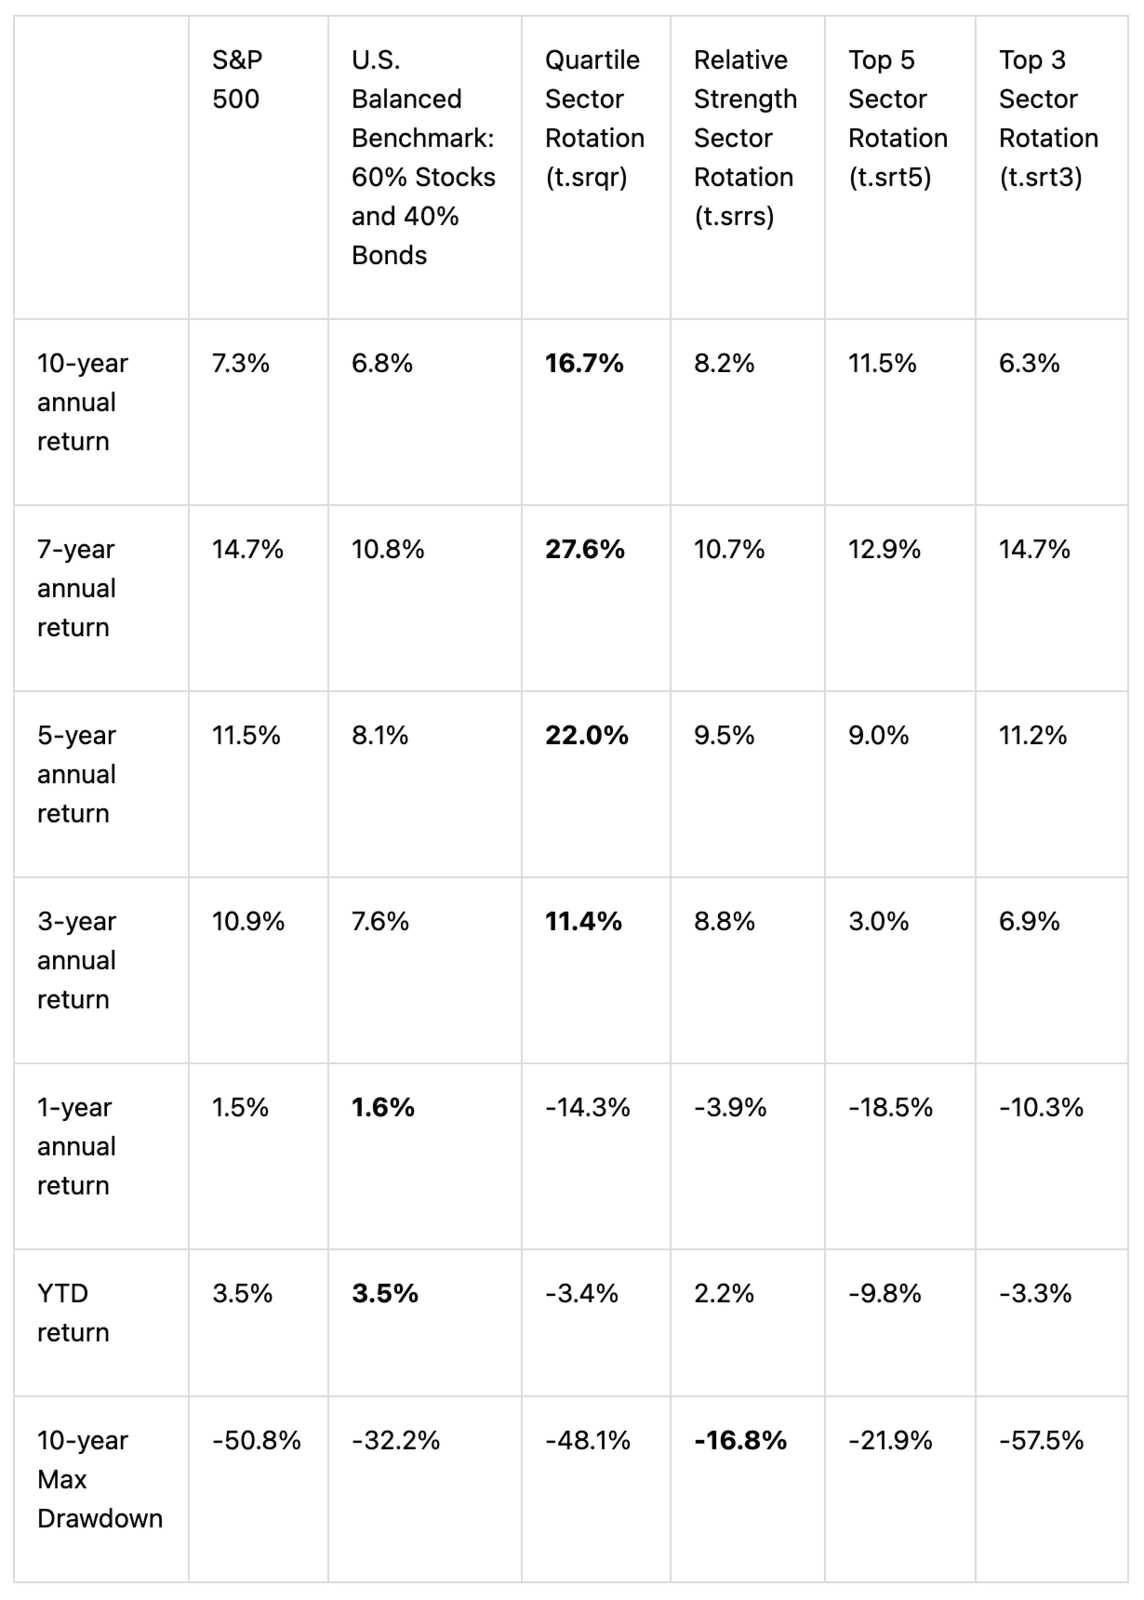
We like looking at the last 10 years since that includes the downturn of 2008-2009 and we can see how these recipes performed during that difficult period. The results are shown below in Exhibit B. The top performing portfolio for each period is shown in bold.
Exhibit B: Four Sector Rotation recipes (and two benchmarks)

Step 4: Interpret the results and identify winners.
Looking at Exhibit B (above), we see three winners emerge:
- Quartile Sector Rotation (t.srqr) is a standout with its 16.7% total annual return. This is more than double the return of SPY (7.3%) during the same period. But this comes with significant risk: the maximum drawdown was 48% over the period, which is on par with SPY's 50.8% drawdown.
- Relative Strength Sector Rotation (t.srrs) offers a portfolio with returns above 8% over the past 10 years, with much lower drawdown compared to the overall market and the other recipes.
- Top 5 Sector Rotation (t.srt5) has struggled over the past 12 months, but over the past 7 and 10 years has done better than Relative Strength Sector Rotation (t.srrs).
Top 3 Sector Rotation (t.srt3) is a non-starter due to its lower returns and higher risk when compared to SPY and the Balanced 60/40 benchmark over most periods.
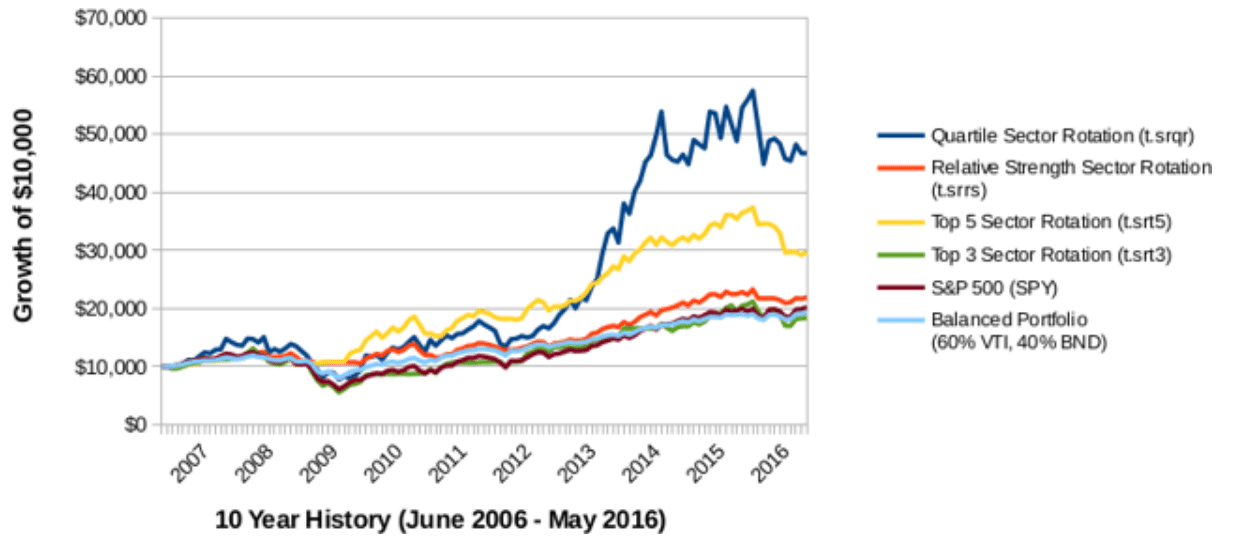
Exhibit C (below) shows the growth of $10,000 over the past 10 years and clearly shows the outperformance of the Quartile Sector Rotation recipe.
Exhibit C: 10-year Total Return of the Sector Rotation recipes

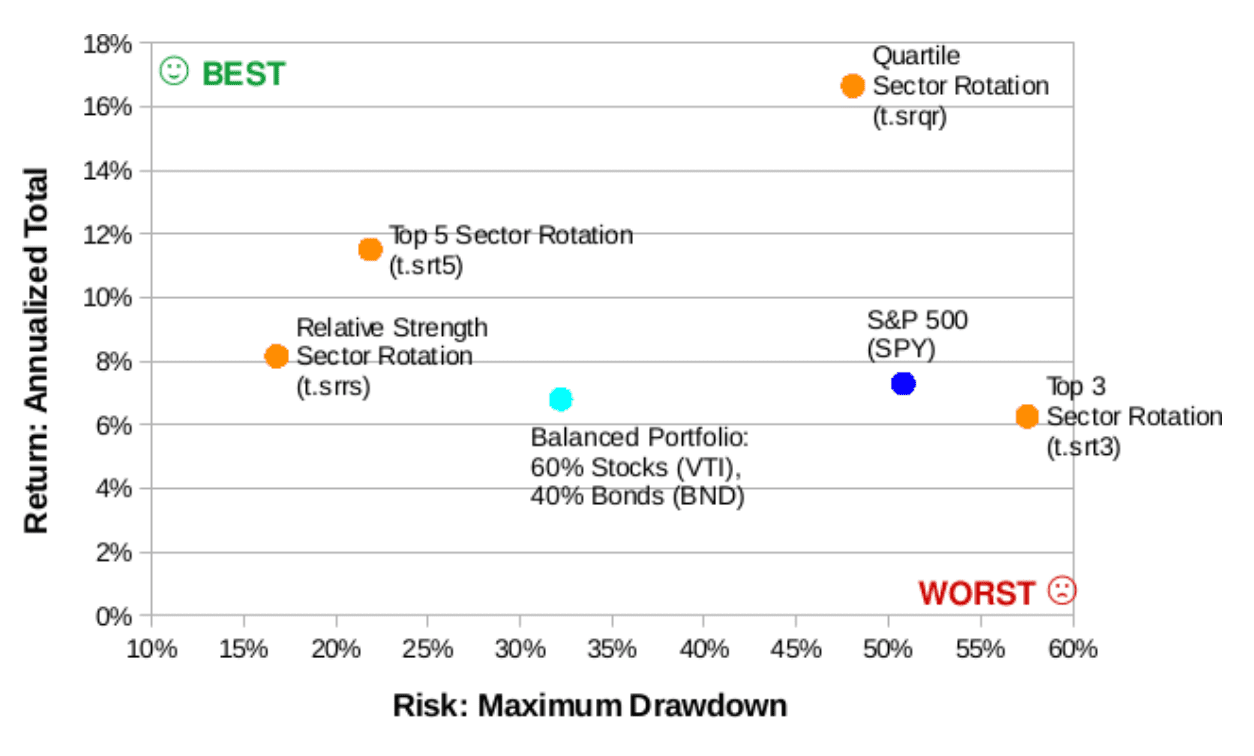
Now let's take a look at a scatterplot that shows the risk of each recipe, using 10-year maximum drawdown. This is shown in Exhibit D (below). We can see that three of the recipes beat SPY by having higher return and lower risk. Two of the recipes (t.srt5 and t.srrs) also beat the Balanced 60/40 benchmark.
Exhibit D: Risk vs. Return for Sector Rotation recipes and benchmarks (10 years ending May 2016)

Since VizMetrics already tracks hundreds of portfolio recipes, let's now compare these four Sector Rotation recipes to ones we already analyze monthly.
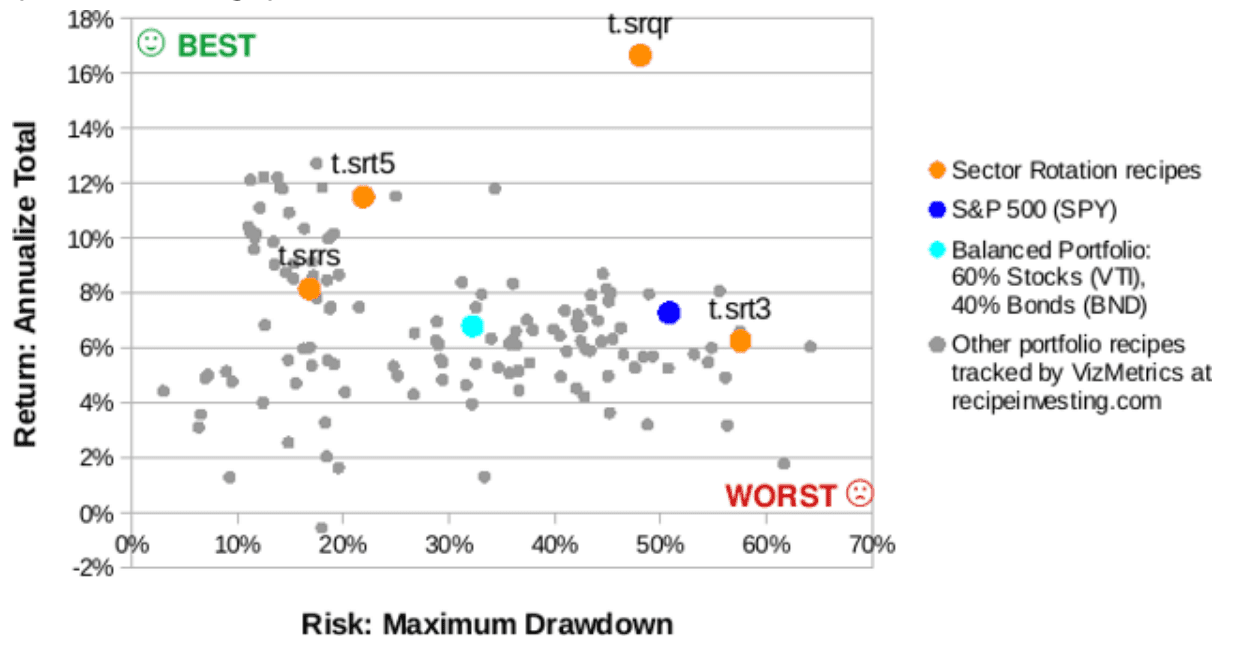
Exhibit E (below) compares the four Sector Rotation recipes (yellow dots) to a larger set of static and dynamic portfolio recipes (gray dots). At the upper right, we can see that the Quartile Sector Rotation (t.srqr) recipe clearly creates a "higher risk, higher return" portfolio.
At the left side, we can see a few gray dots above and to the left of t.srt5. These represent investing recipes tracked at Recipe Investing that have higher return and lower risk. These could be tactical do-it-yourself, managed, or static allocation portfolios.
Exhibit E: Risk vs. Return: Sector Rotation recipes compared to other portfolio recipes (10 years ending May 2016)

Conclusions
If your focus is lower risk, then the Relative Strength Sector Rotation (t.srrs) recipe balances risk and return and has beaten the Balanced 60/40 benchmark portfolio over the recent 3-, 5-, and 10-year periods. Over the past 10 years, it has outperformed the S&P 500 with much less risk.
If your focus is lower risk, then the Relative Strength Sector Rotation (t.srrs) recipe balances risk and return and has beaten the Balanced 60/40 benchmark portfolio over the recent 3-, 5-, and 10-year periods. Over the past 10 years, it has outperformed the S&P 500 with much less risk.
as published on
Disclosure: I am/we are long EFA, IWM, GLD, TLT, QQQ, SPY, EEM. I wrote this article myself, and it expresses my own opinions. I am not receiving compensation for it. I have no business relationship with any company whose stock is mentioned in this article.
