8 Balanced Portfolios Compared: Vanguard, Janus, And Others Vs. A 60-40 2 ETF Portfolio
8 Balanced Portfolios Compared: Vanguard, Janus, And Others Vs. A 60-40 2 ETF Portfolio
Our recent article "3 Portfolios Inspired By Graham, Swensen, Browne" elicited the suggestion that we compare a do-it-yourself ETF portfolio of 60% stocks and 40% bonds to Vanguard's Balanced Fund (MUTF:VBIAX). That also made us think about the other balanced funds from the leading fund companies.
Specifically, here are the two questions we want to answer:
- Which "balanced fund" has the best risk-adjusted returns?
- Can I do better creating my own balanced ETF portfolio using 60% stocks (NYSEARCA:VTI) and 40% bonds (NASDAQ:BND)?
Choosing the Portfolios
First, we identified balanced funds from the major fund companies. Here's the list with each ticker and annual expense according to the prospectus:
- Dodge & Cox Balanced (MUTF:DODBX) 0.53%
- Fidelity Balanced (MUTF:FBALX) 0.60%
- Fidelity Global Balanced (MUTF:FGBLX) 1.04%
- Ibbotson Balanced (MUTF:BETFX) 0.92%
- Janus Balanced (MUTF:JANBX) 0.72%
- Schwab Balanced (MUTF:SWOBX) 0.65%
- Vanguard Balanced (VBIAX) 0.10%
- Wells Fargo Advantage Index Asset Allocation (MUTF:WFAIX) 0.91%
We also created a benchmark portfolio of 60% VTI and 40% BND.
This static 60-40 portfolio has a 0.07% blended annual expense based on VTI expenses of 0.05% and BND expenses of 0.10%.
Looking at the numbers
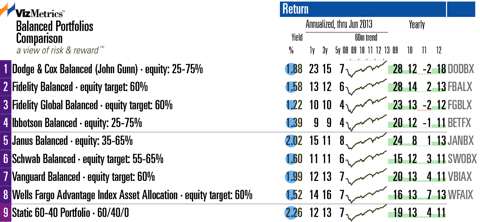
In the table below, we see that Ibbotson has lagged the group, Dodge & Cox has performed the best over the past year, and Janus leads over the past 5 years.

Note the varying amount of equity that each fund can hold, as shown in the descriptions above. Each manager's discretion varies between these funds. While "balanced fund" usually implies a fixed or stable stock-bond allocation, such as 60% stocks and 40% bonds, some of these fund managers have more discretion to change the level of stock holdings. For example, looking at the prospectus for Janus Balanced, we see that the fund manager can hold between 35% and 65% in equities. In contrast, Vanguard sticks to a firmer 60% equity guideline.
Turning to the topic of a do-it-yourself ETF portfolio, a balanced ETF portfolio using a combination of 60% VTI and 40% BND has seen these results:
- 1-year return: 11.84%
- 3-year return: 12.60%
- 5-year return: 6.97%, with a maximum drawdown of -26.7% over the past 5 years.
Meanwhile, VBIAX has seen the following returns:
- 1-year return: 12.18%
- 3-year return: 12.70%
- 5-year return: 7.07%, with a maximum drawdown of -27.0% over the past 5 years.
So VBIAX edges out the do-it-yourself ETF combo in all three time periods, but with a slightly higher maximum drawdown.
Risk-adjusted returns
Over the past year, Dodge & Cox has shown a 13.4% Modigliani risk-adjusted return, which is the best in this group. Over the past 5 years, Janus Balanced has shown the best risk-adjusted return, with a 12.5% Modigliani risk-adjusted measure.
To see a graphical comparison of risk and risk-adjusted returns, visit Balanced Portfolios: Risk & Risk-Adjusted Returns. The analysis uses standard deviation, maximum drawdown, beta, Modigliani, and alpha over the past 1, 3, and 5 years.
Risk vs. Return Scatterplot
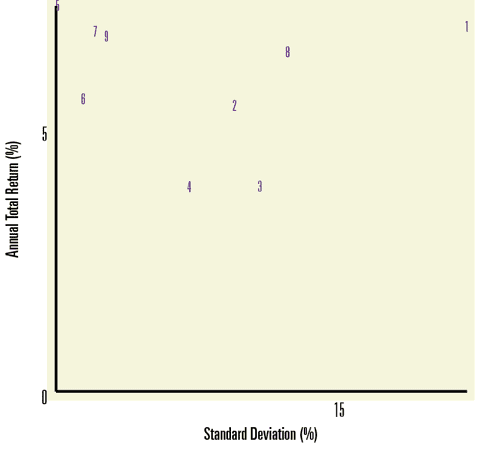
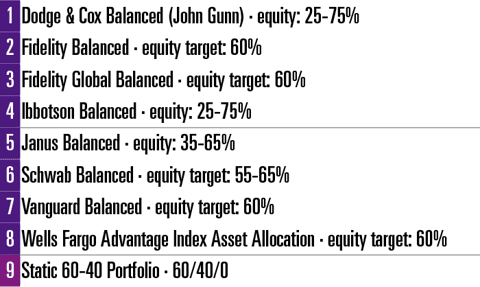
The chart below plots Standard Deviation vs. Total Return for each portfolio. The most desirable spot is the top left corner, occupied by Janus Balanced (#5 on the chart).


To see the 1-year and 3-year risk vs. return scatterplots, visit Balanced Funds: Risk vs. Return Scatterplots.
Conclusion
Now back to our questions at the beginning of the article:
Question 1: Which balanced fund is best on a risk-adjusted basis?
Answer: Janus Balanced is the clear winner on a 5-year risk-adjusted basis. If you have an appetite for more risk, Dodge & Cox Balanced has performed better over the past year, but slightly lags Janus Balanced over the 5-year period.
Question 2: Can I do better creating my own balanced ETF portfolio using 60% VTI and 40% BND?
Answer: Not likely. If you are interested in an easy 60-40 portfolio, you are probably better off (in terms of overall risk and performance) by simply buying VBIAX. The ETF portfolio does offer a 0.03% cost advantage over VBIAX, but for that extra $30 (if you have $100K invested) Vanguard's team will do the rebalancing for you.
as published on
Disclosure: I am/we are long EFA, IWM, GLD, TLT, QQQ, SPY, EEM. I wrote this article myself, and it expresses my own opinions. I am not receiving compensation for it. I have no business relationship with any company whose stock is mentioned in this article.
